
Manufacturing reports and production analytics
Twelve reports, built from what the floor already recorded. Work order progress, production cost, BOM stock readiness, operator output, and the materials still waiting to move, without exporting anything into a spreadsheet first.
Twelve reports across four parts of the operation
Production status, planning, workforce output and supply chain. Each one reads live records, so there is no gap between what happened on the floor and what the report says.
Production monitoring
Work order status, job card progress and item-wise output. The three most people open first thing in the morning.
Planning and scheduling
Whether you have the stock to start, and what the employee and operation schedules look like for a given period.
Workforce and operations
Operator output against target, and the operations that keep running longer than the routing says they should.
Supply chain and cost
What still has to be transferred out, what you are waiting on, and the period cost breakdown underneath it all.
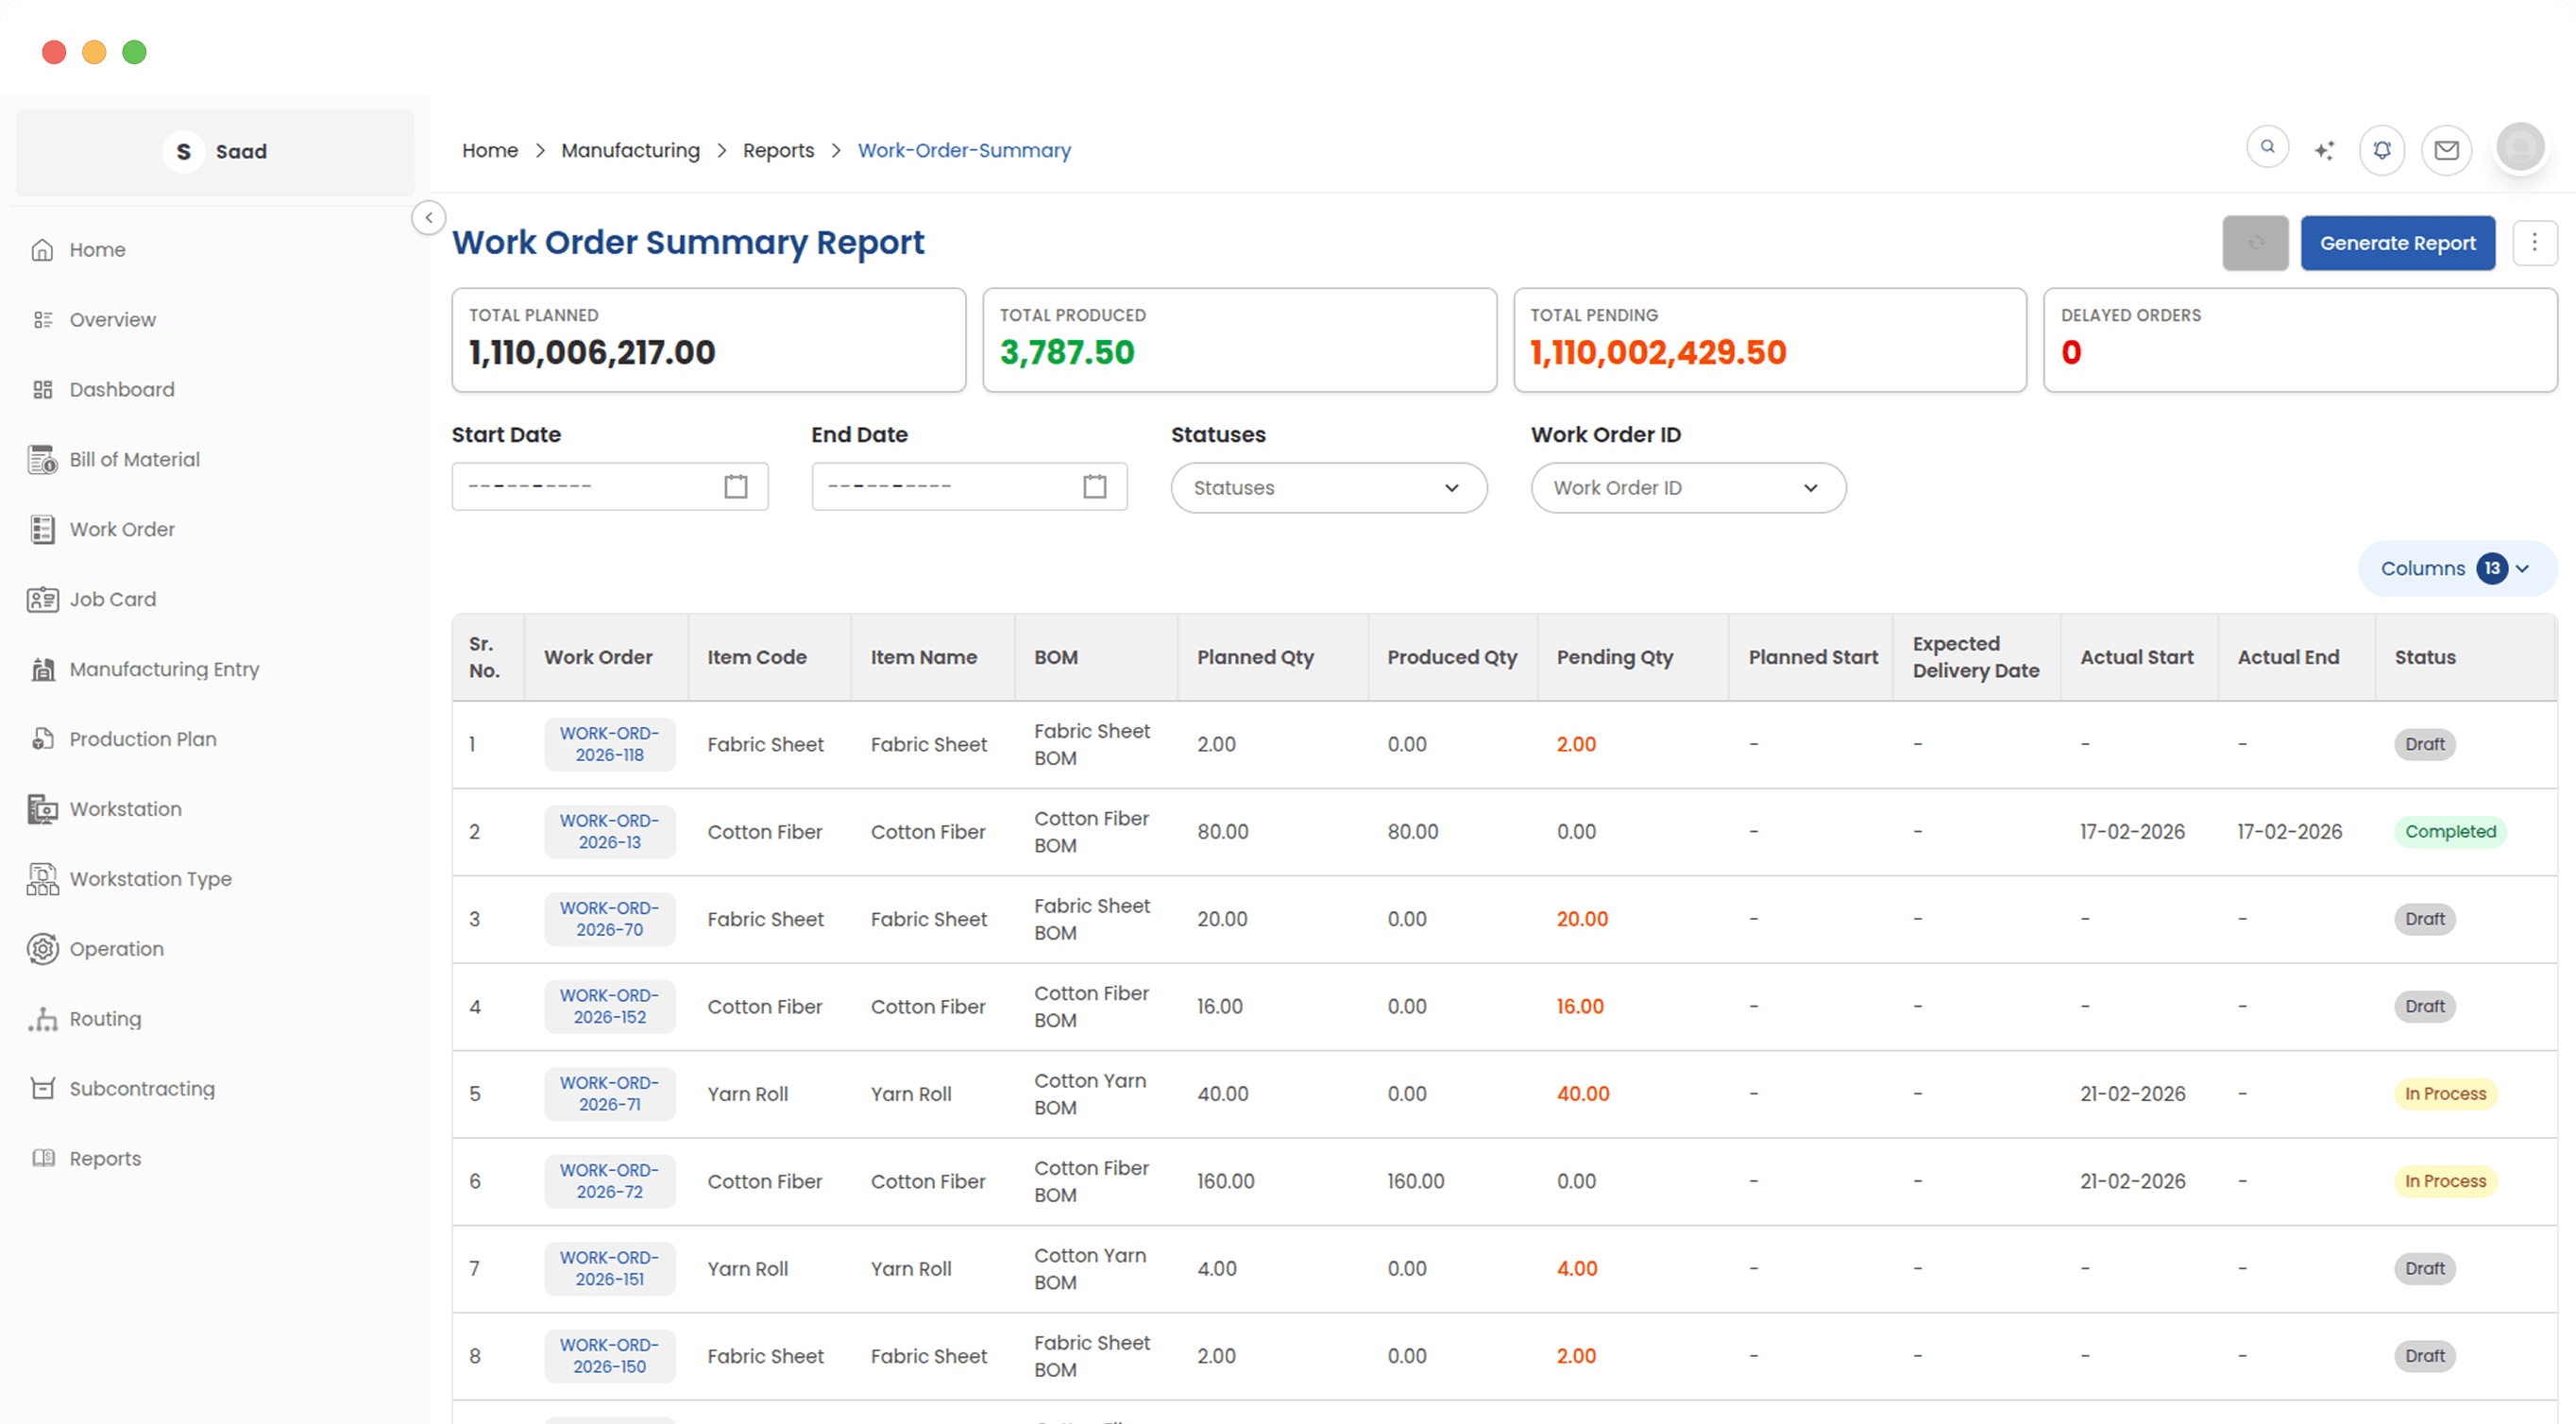
Know where every production job stands
Which jobs are on track, which are behind, and which have already gone past their delivery date. It is the report that replaces walking the floor asking people how it is going.
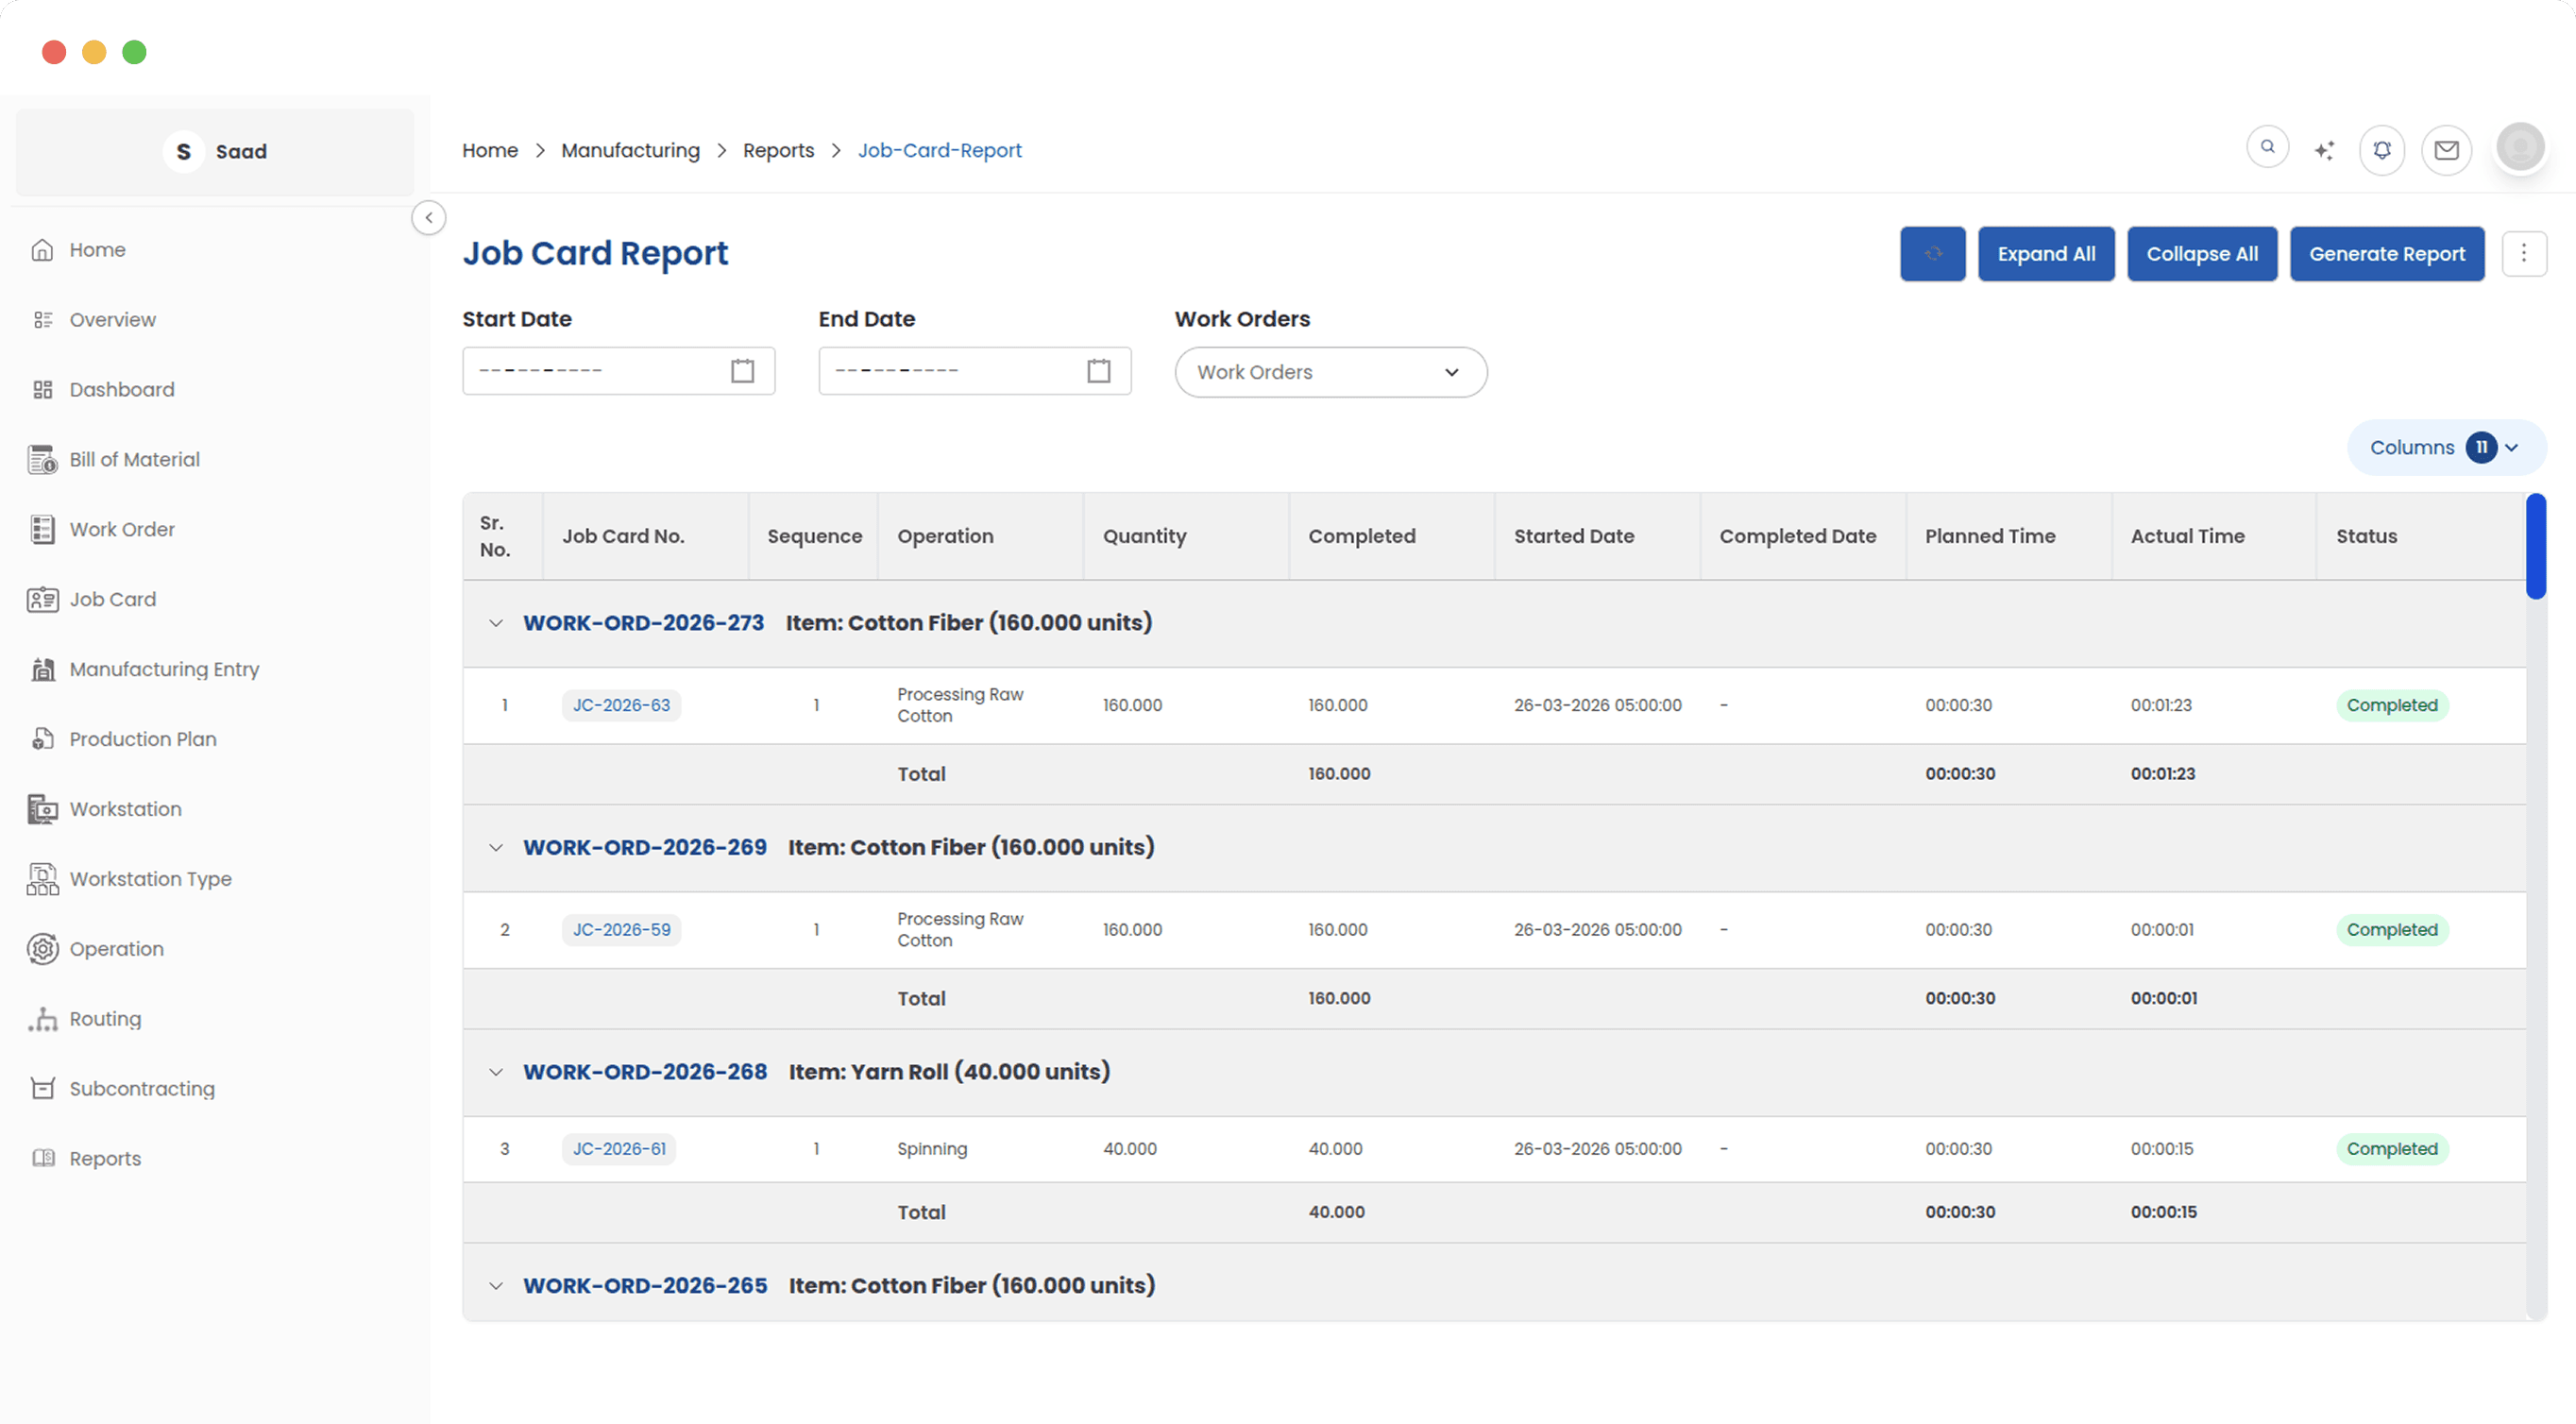
The Kanban board as a list
Every task on the floor with who it is assigned to, how far along it is and whether it finished on time. The board is better for watching the day; this is better for reviewing it afterwards or sending it to someone.
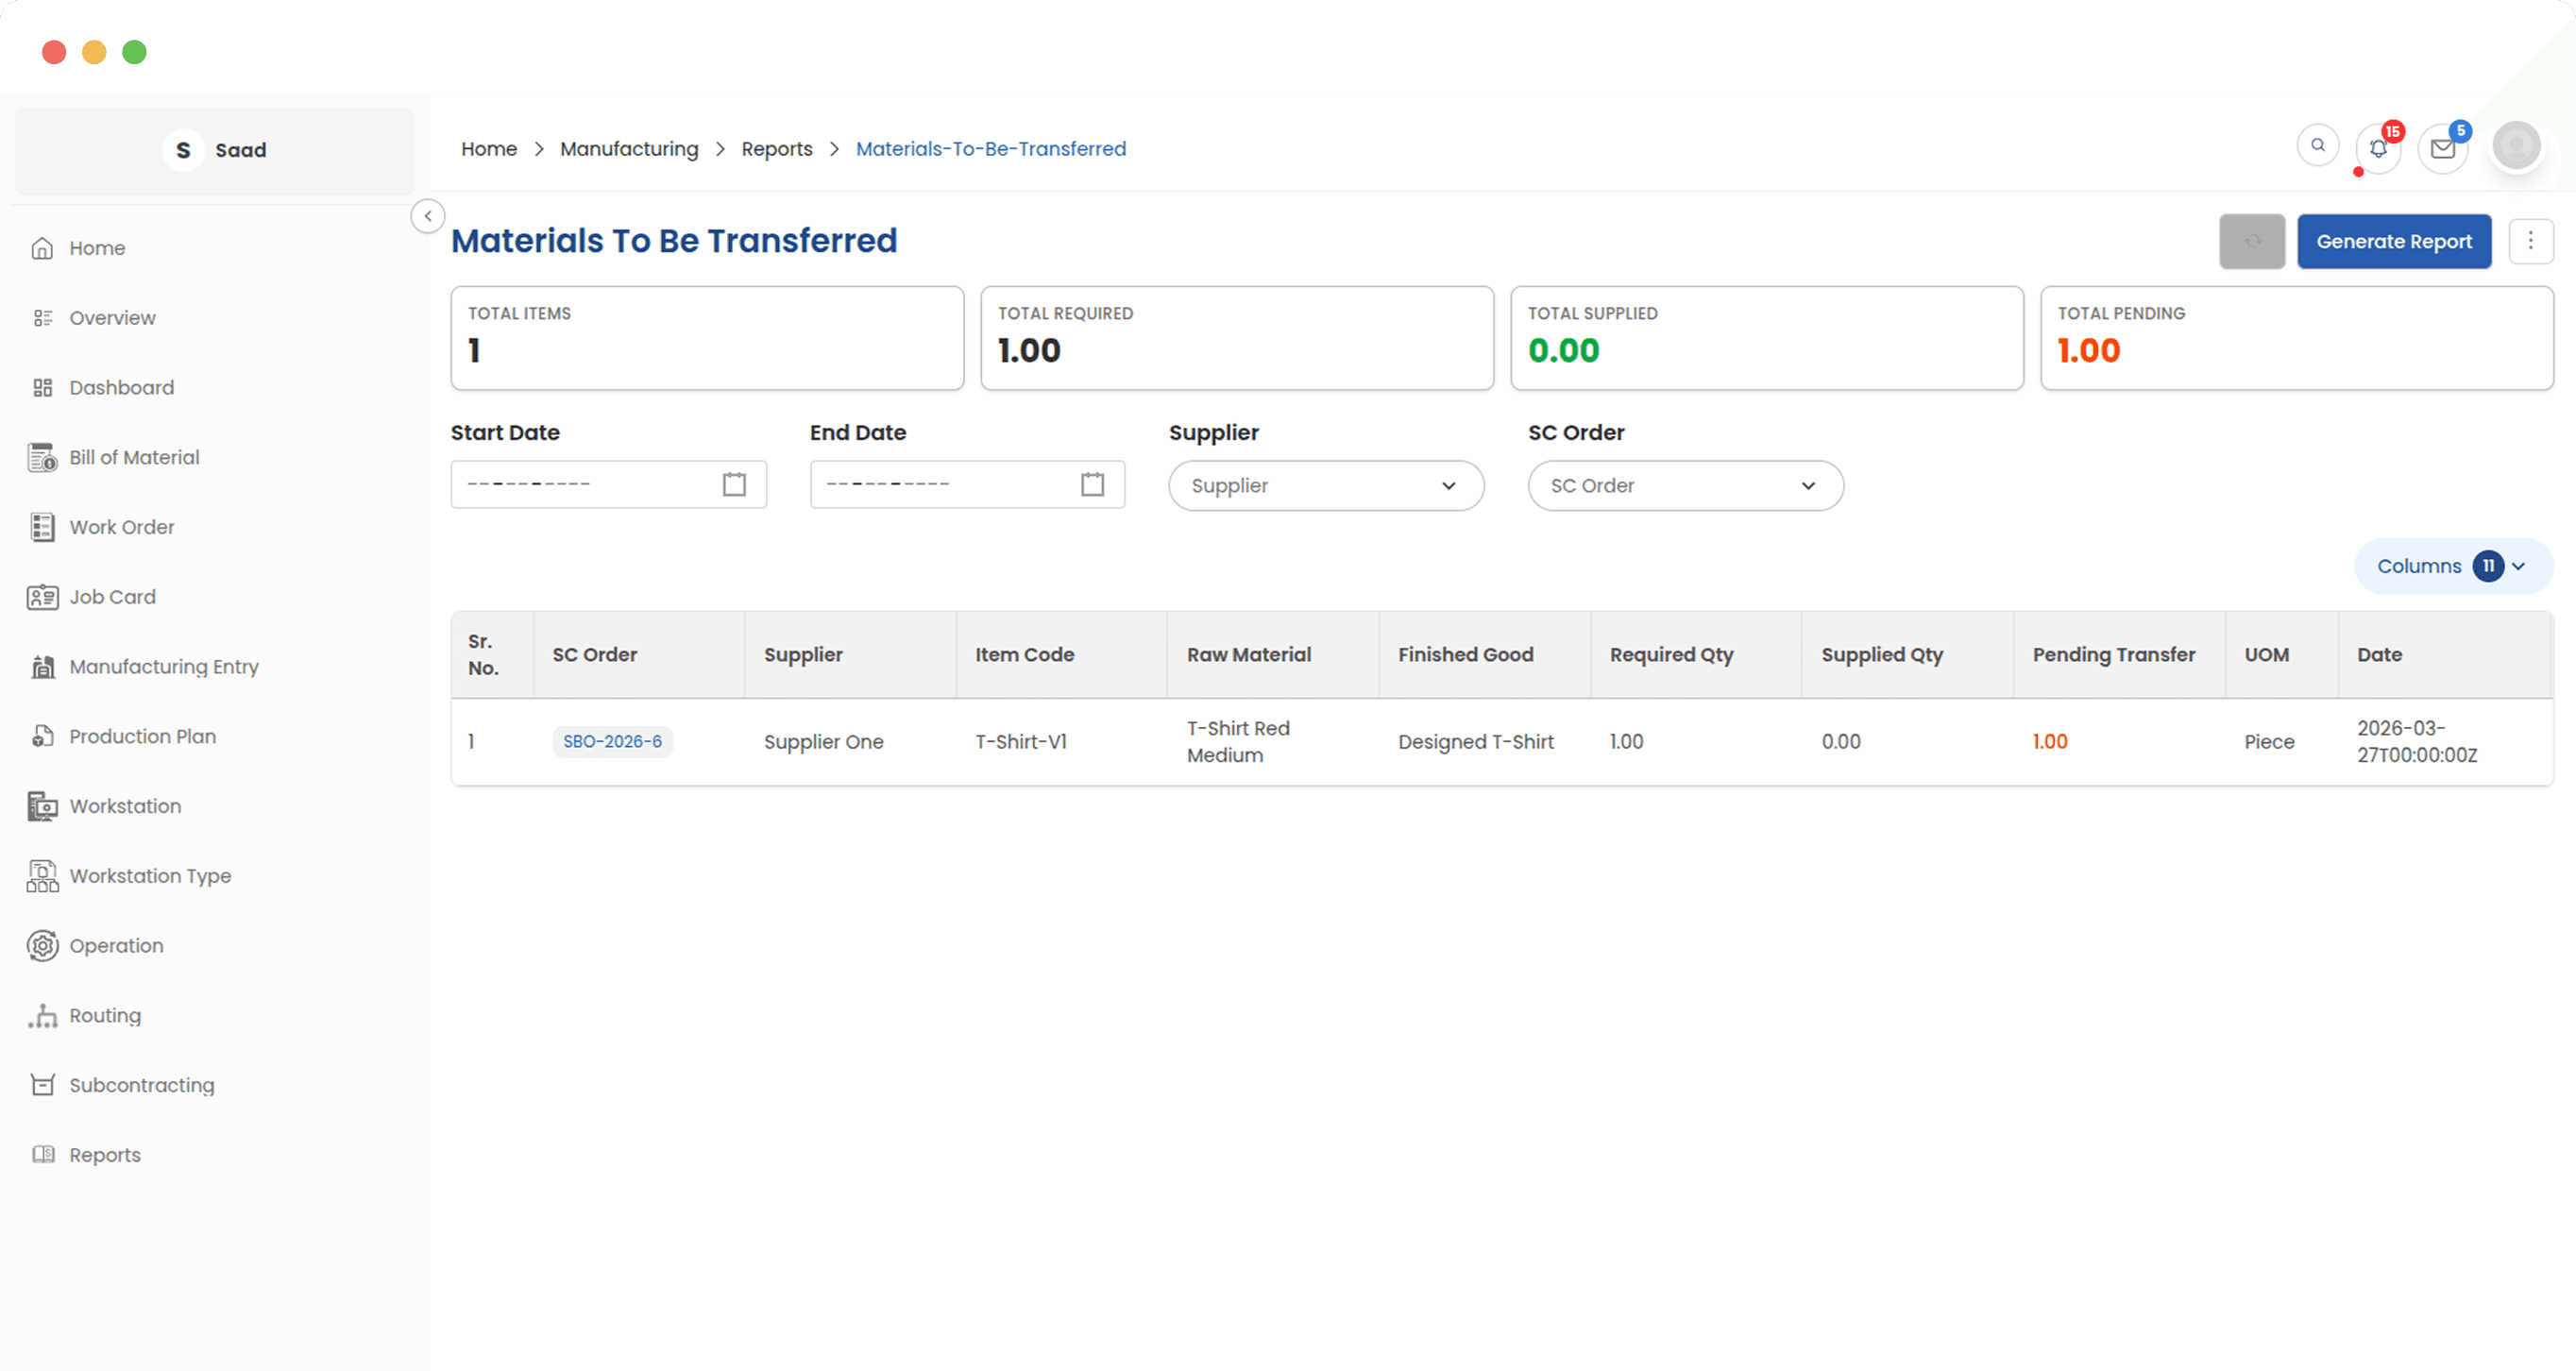
What still has to leave the warehouse
Raw material that open subcontracting orders need and that has not gone out yet. Warehouse teams work off it so a job worker is never idle waiting on something sitting in your own store.
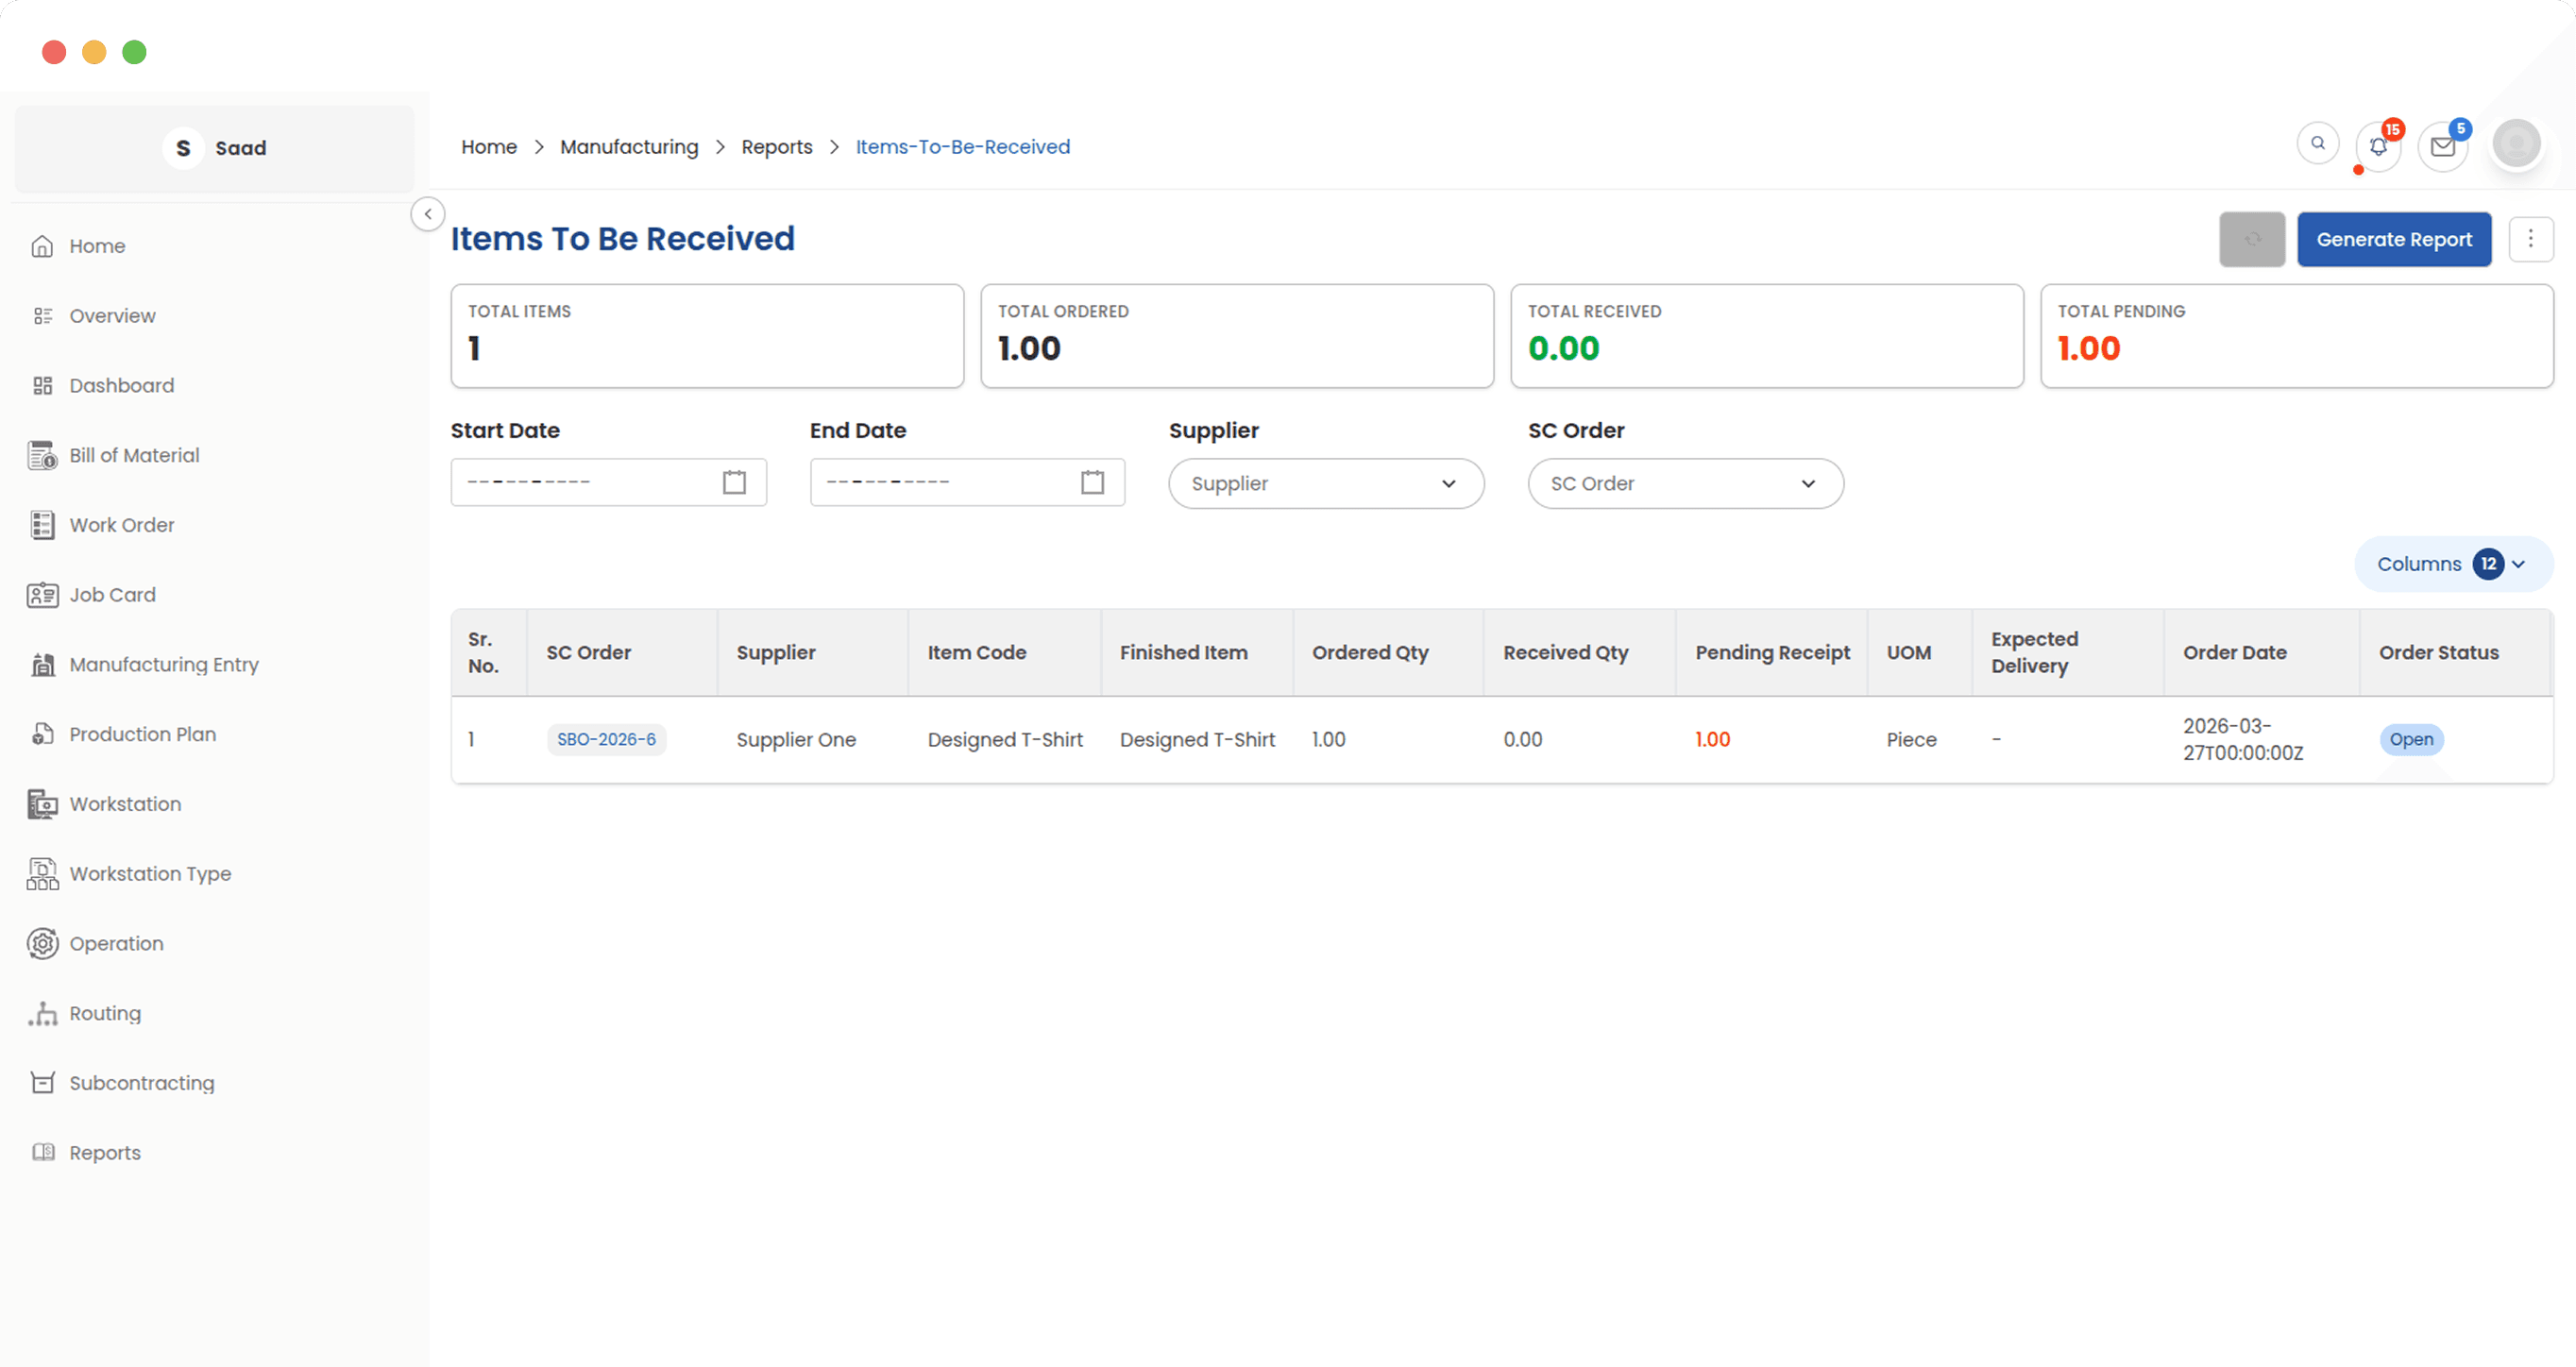
What you are still waiting to get back
Everything sent out to a job worker that has not come back as finished goods. Purchasing chases from this list, and it is usually the first place to look when stock is short and nobody knows why.
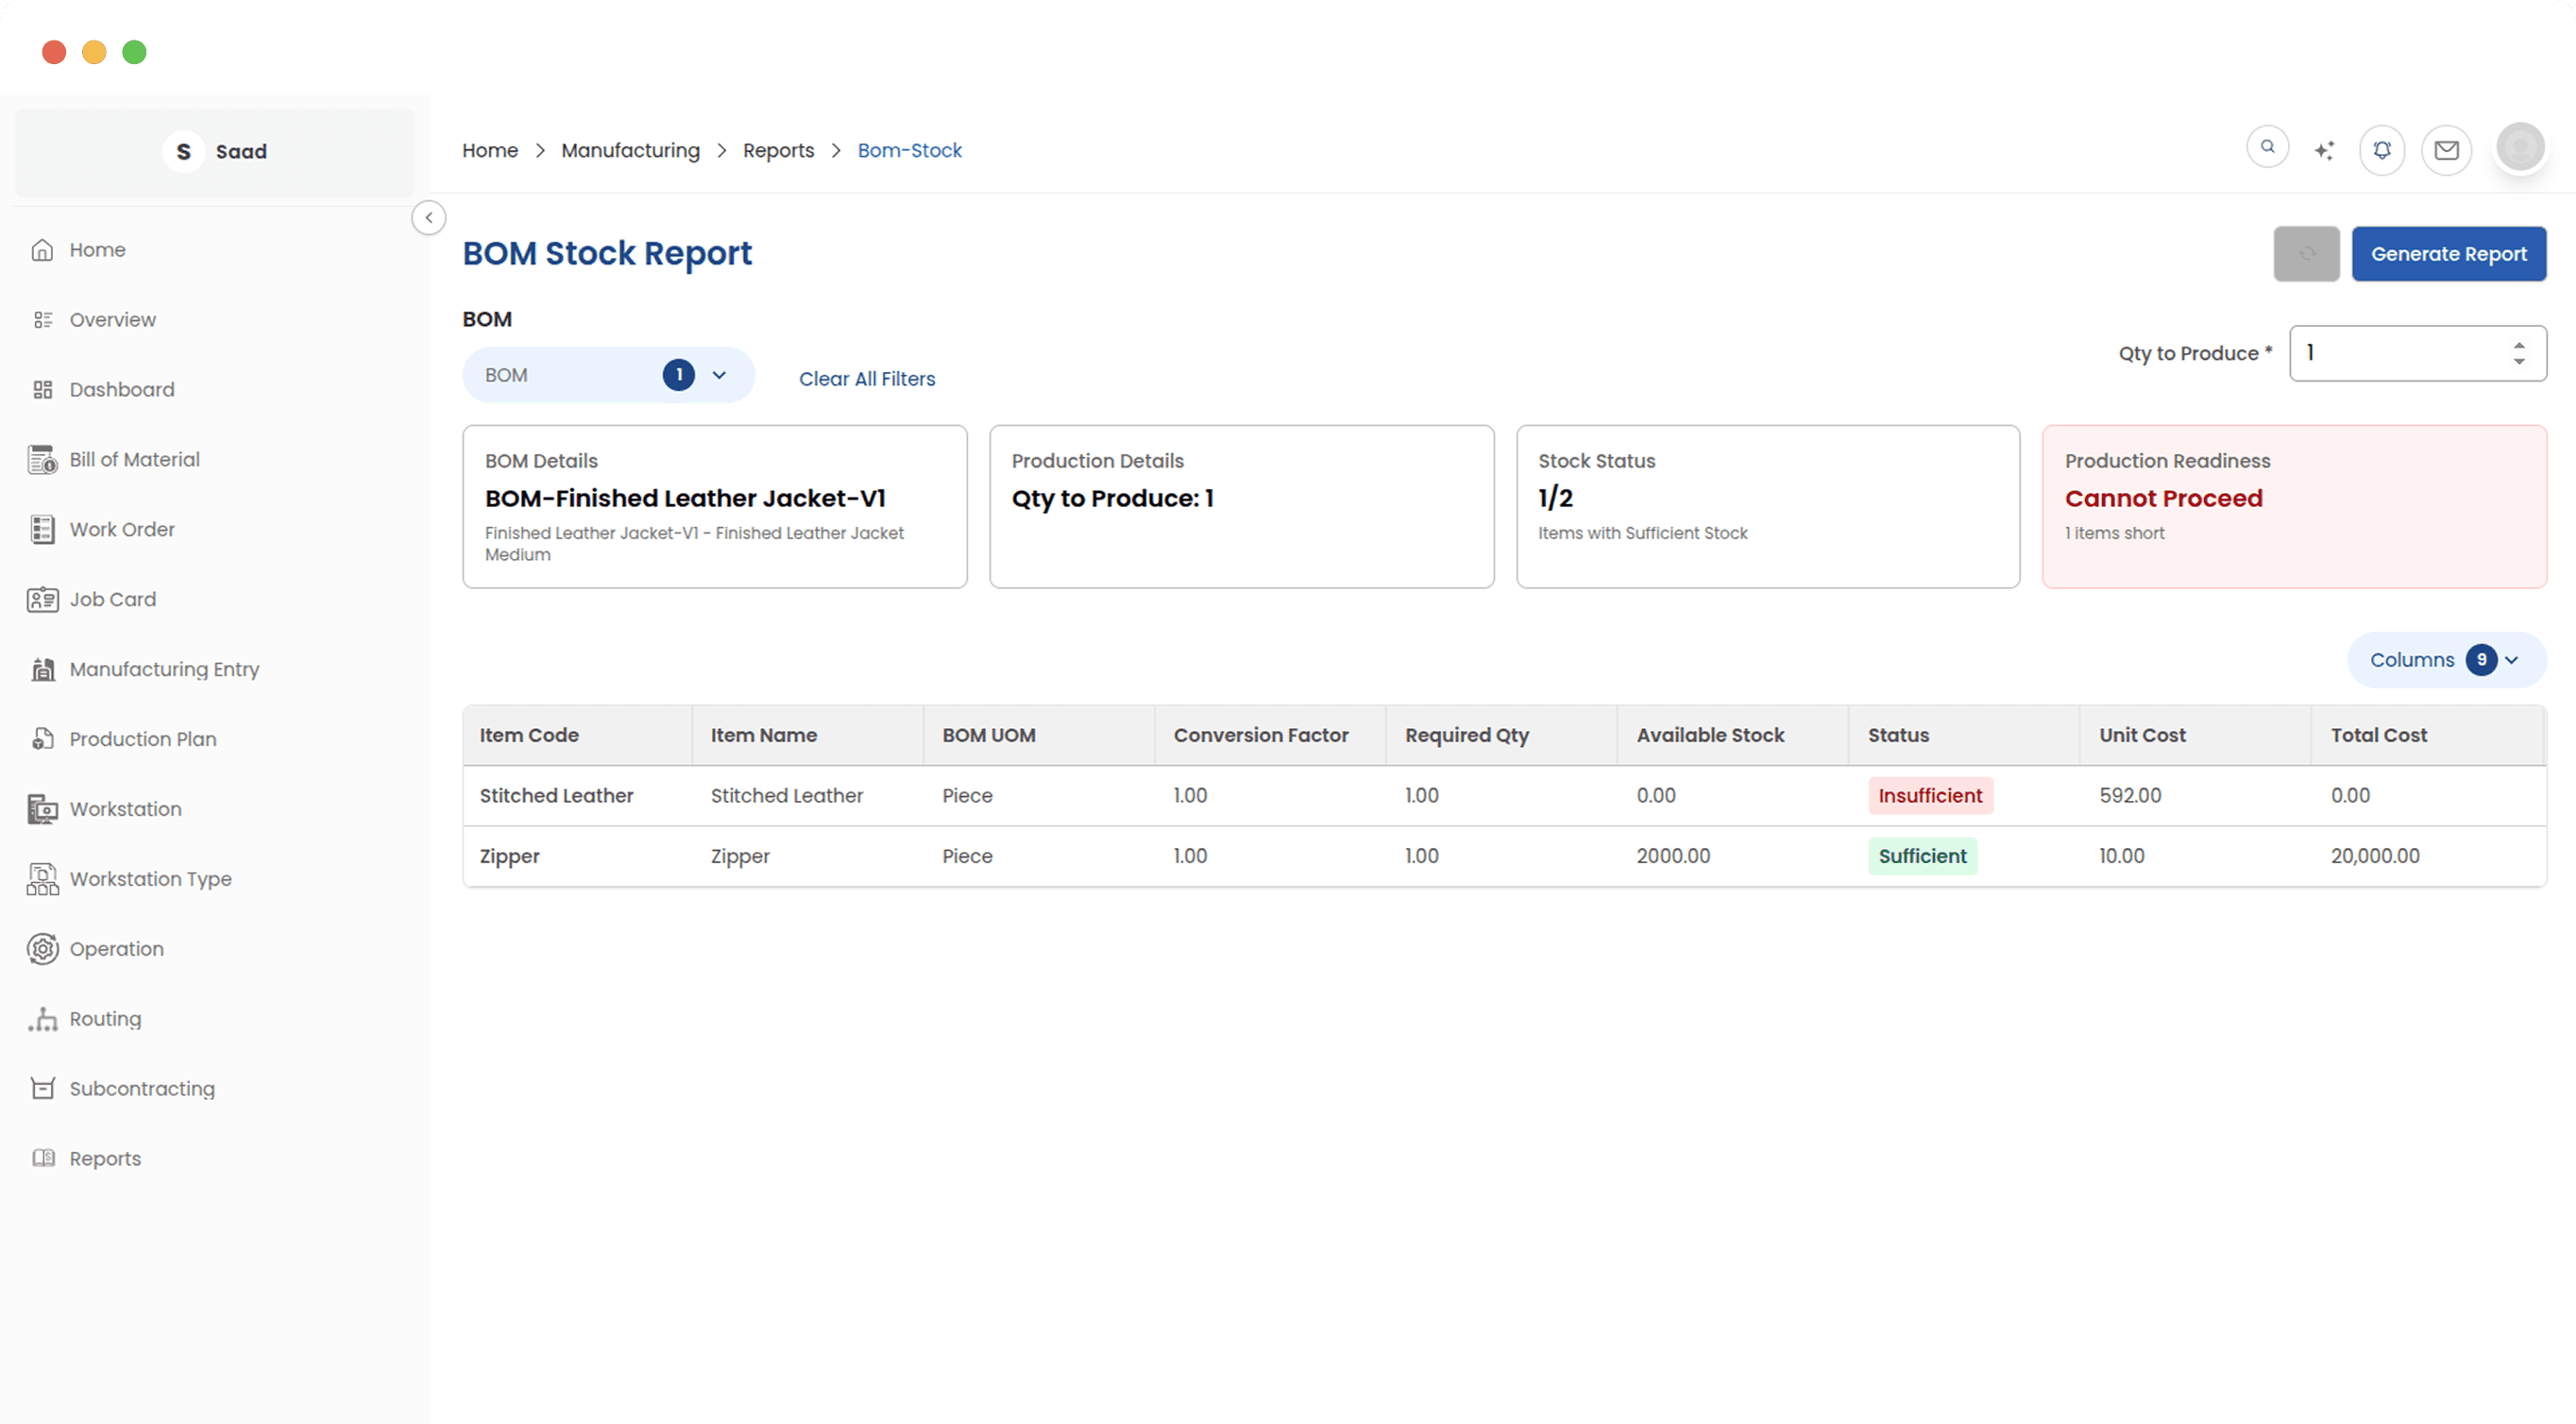
Do we have everything to start
Pick an approved BOM and a quantity, and it checks current stock against every raw material that BOM needs. It is the question worth asking before a work order is raised rather than after.
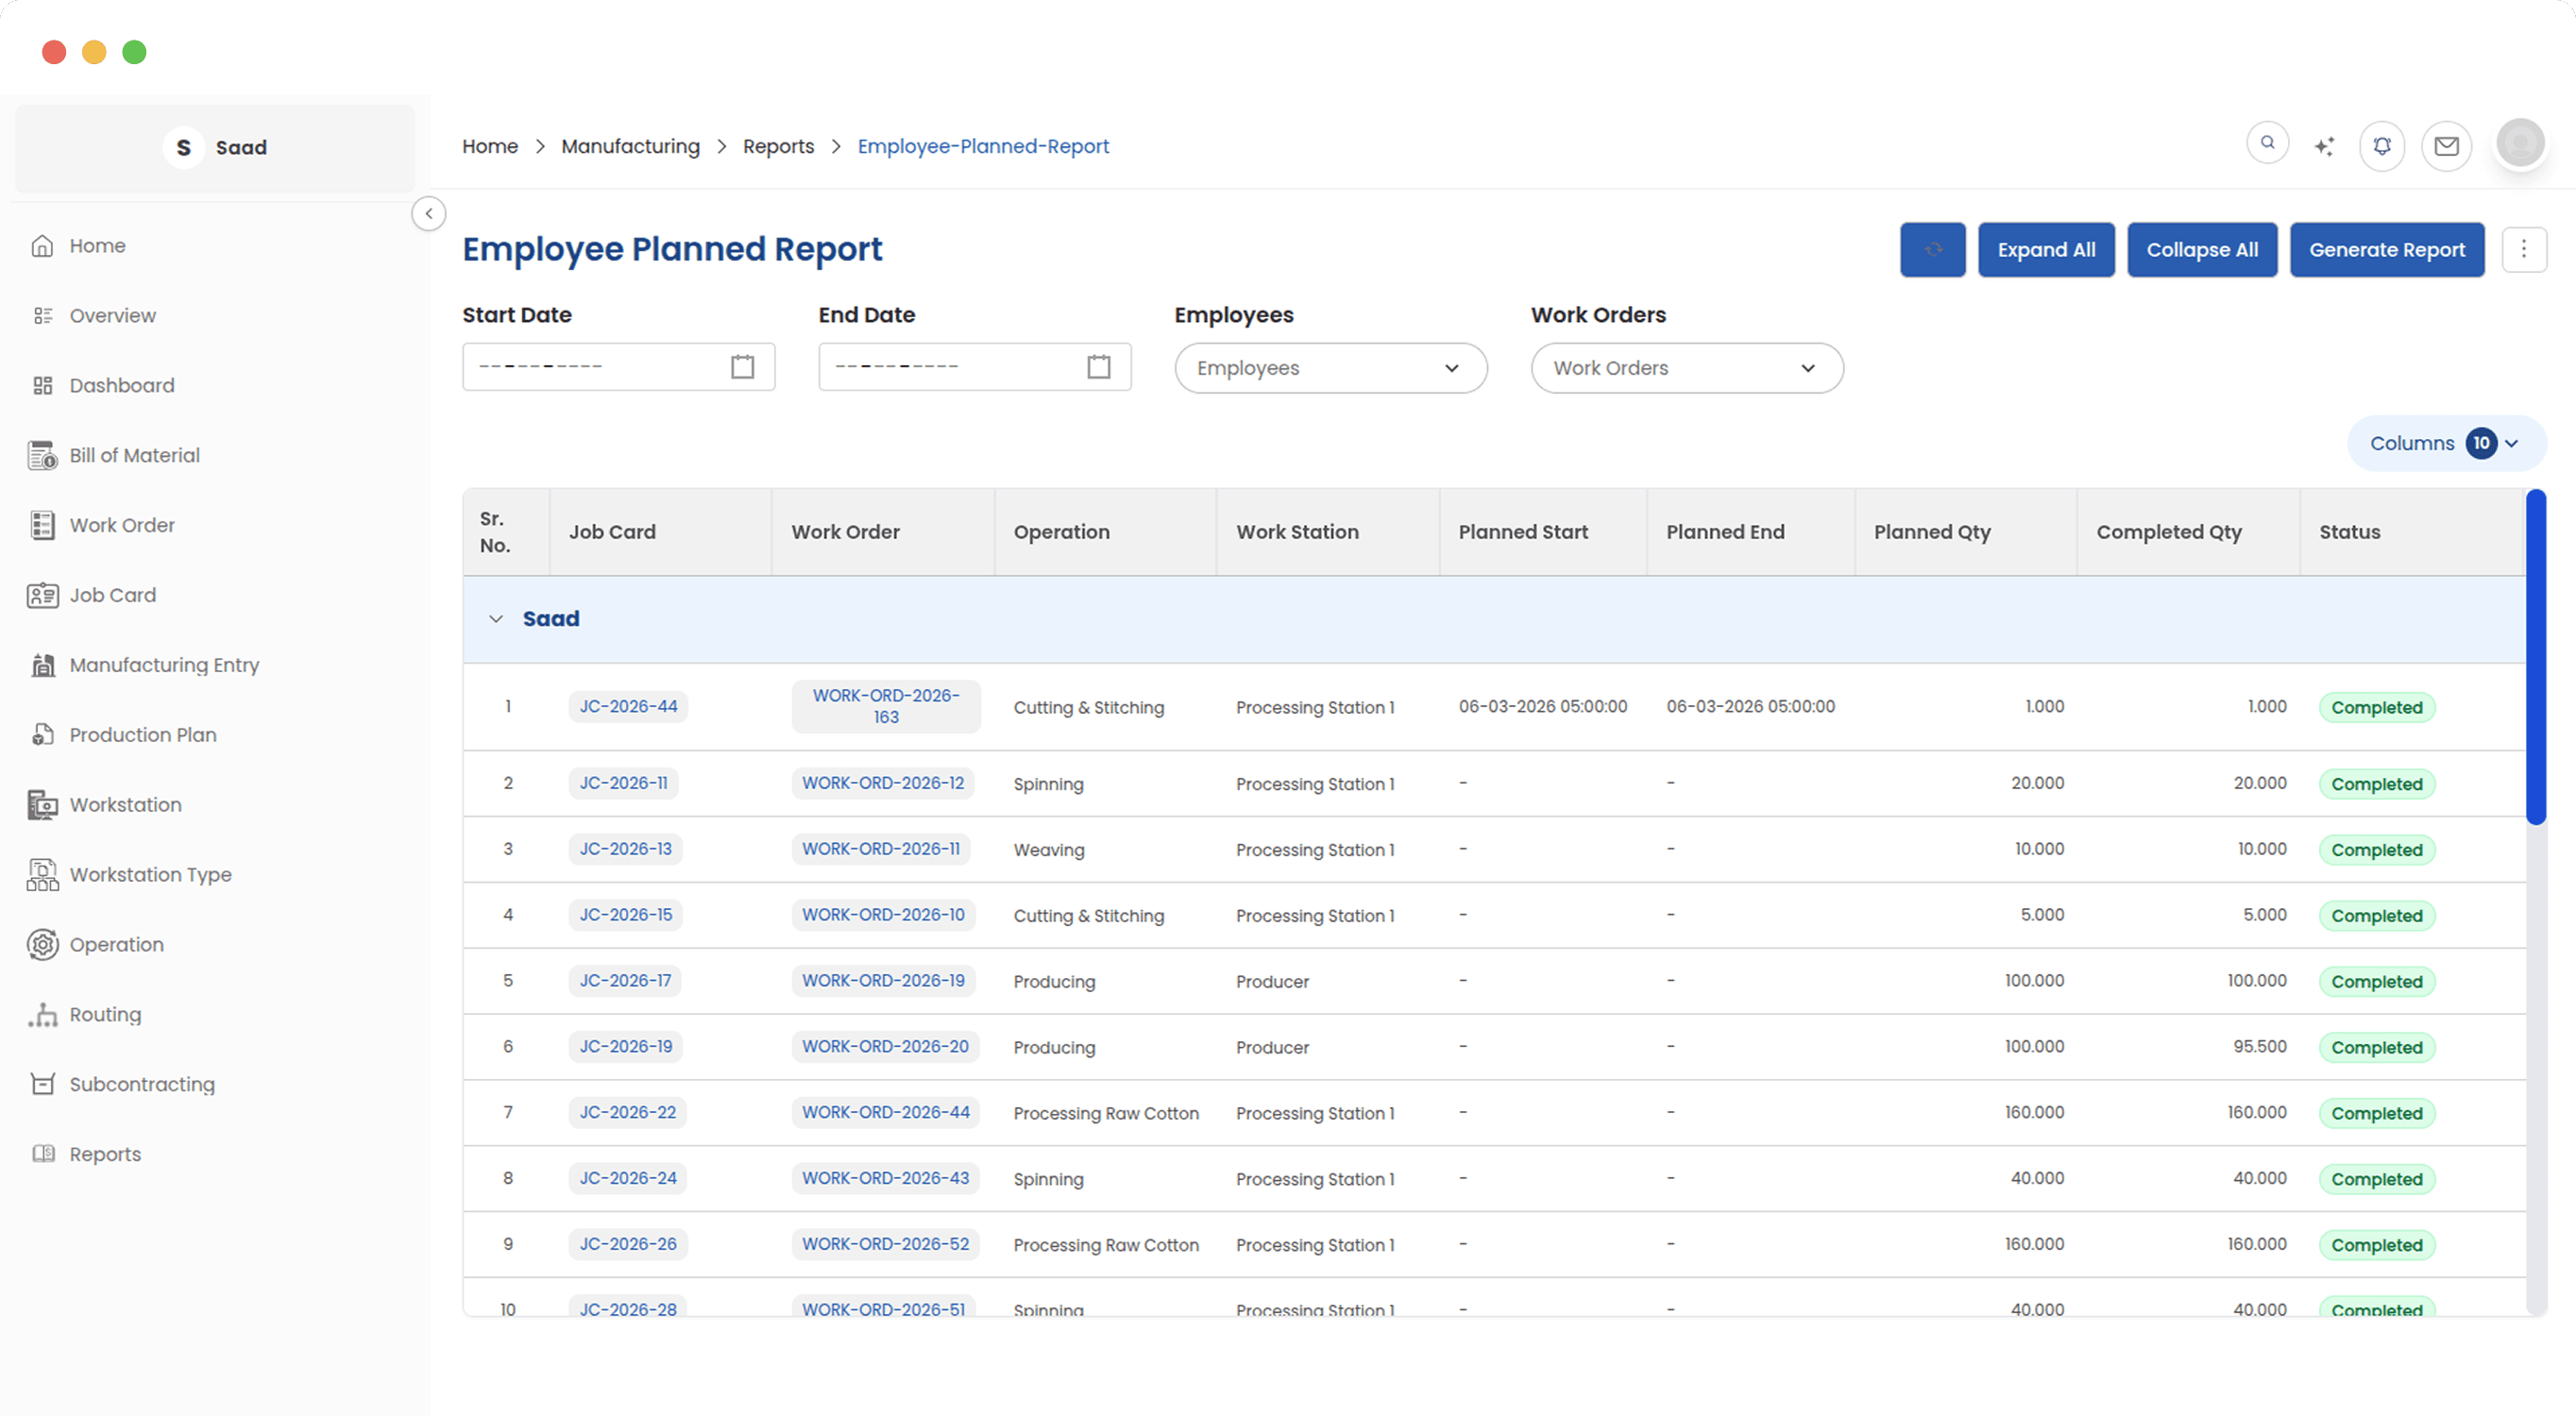
See every employee's production schedule in one view
Job cards grouped by the person doing them, in the order they are meant to run. Supervisors use it the evening before to check nobody is holding six hours of work in a five-hour shift.
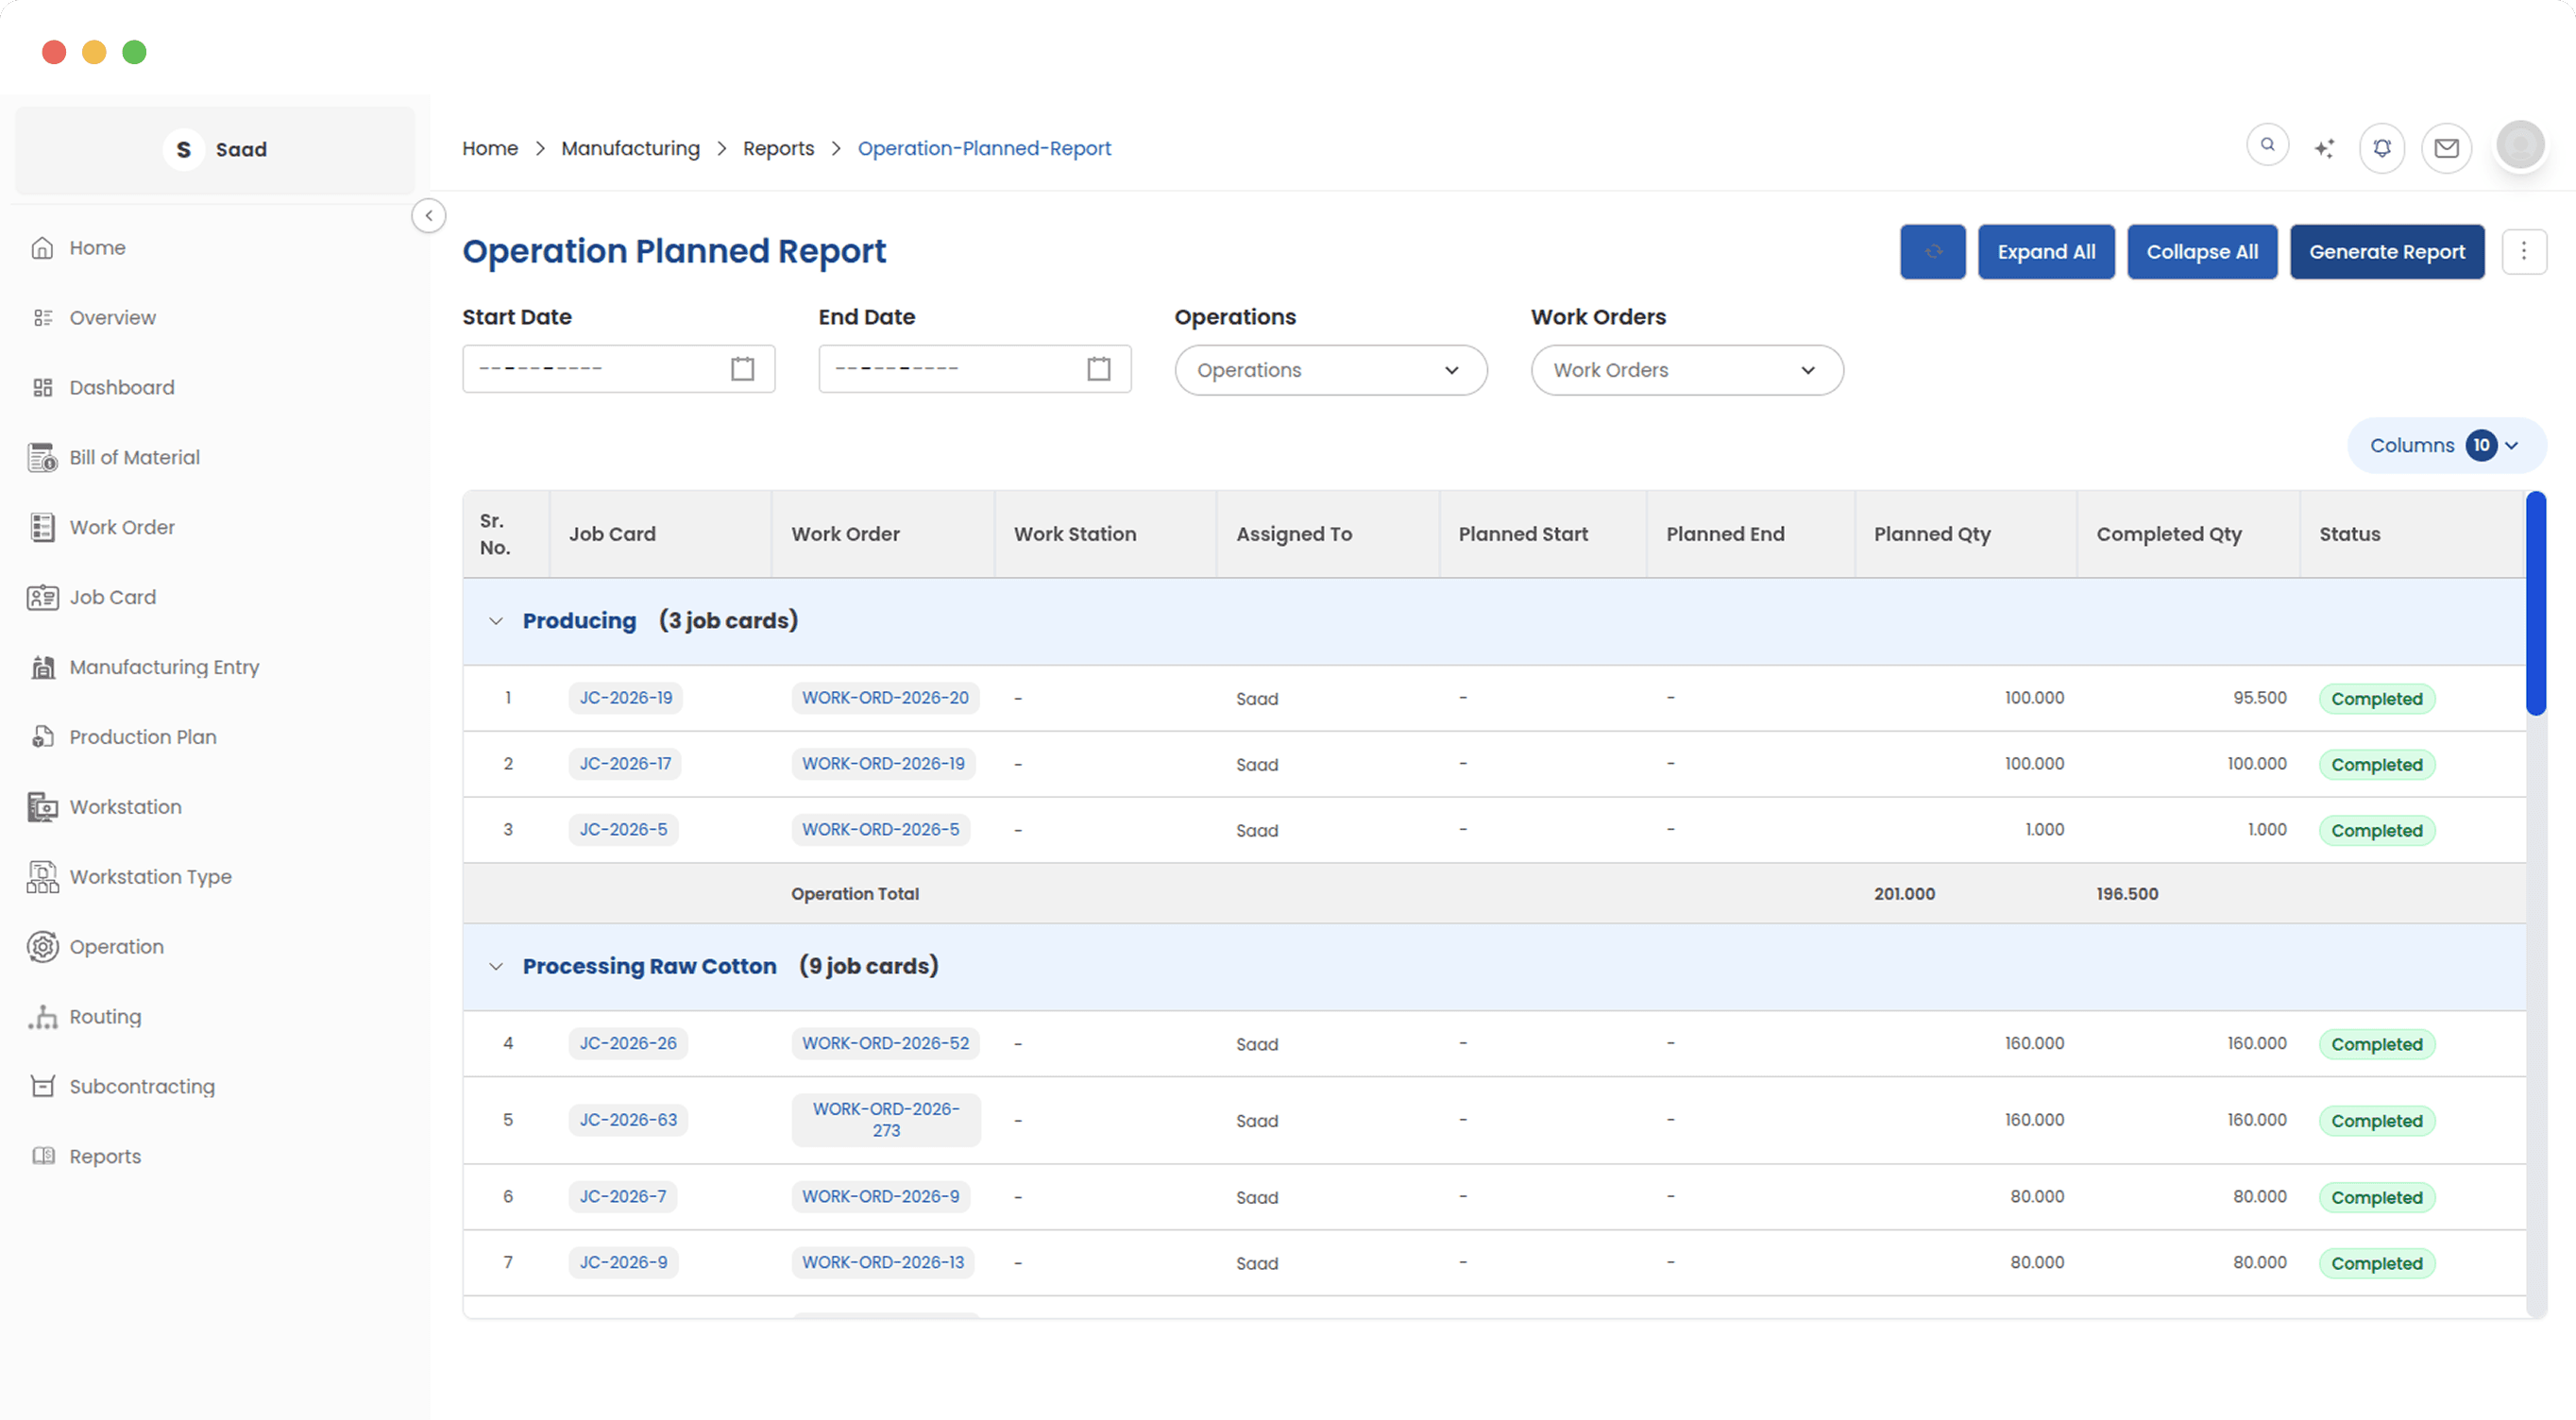
How the schedule loads your machines
When each operation is due to run, which workstation it lands on, and how that compared to reality last time. Planners read it to find the machine that is carrying twice what the others are.
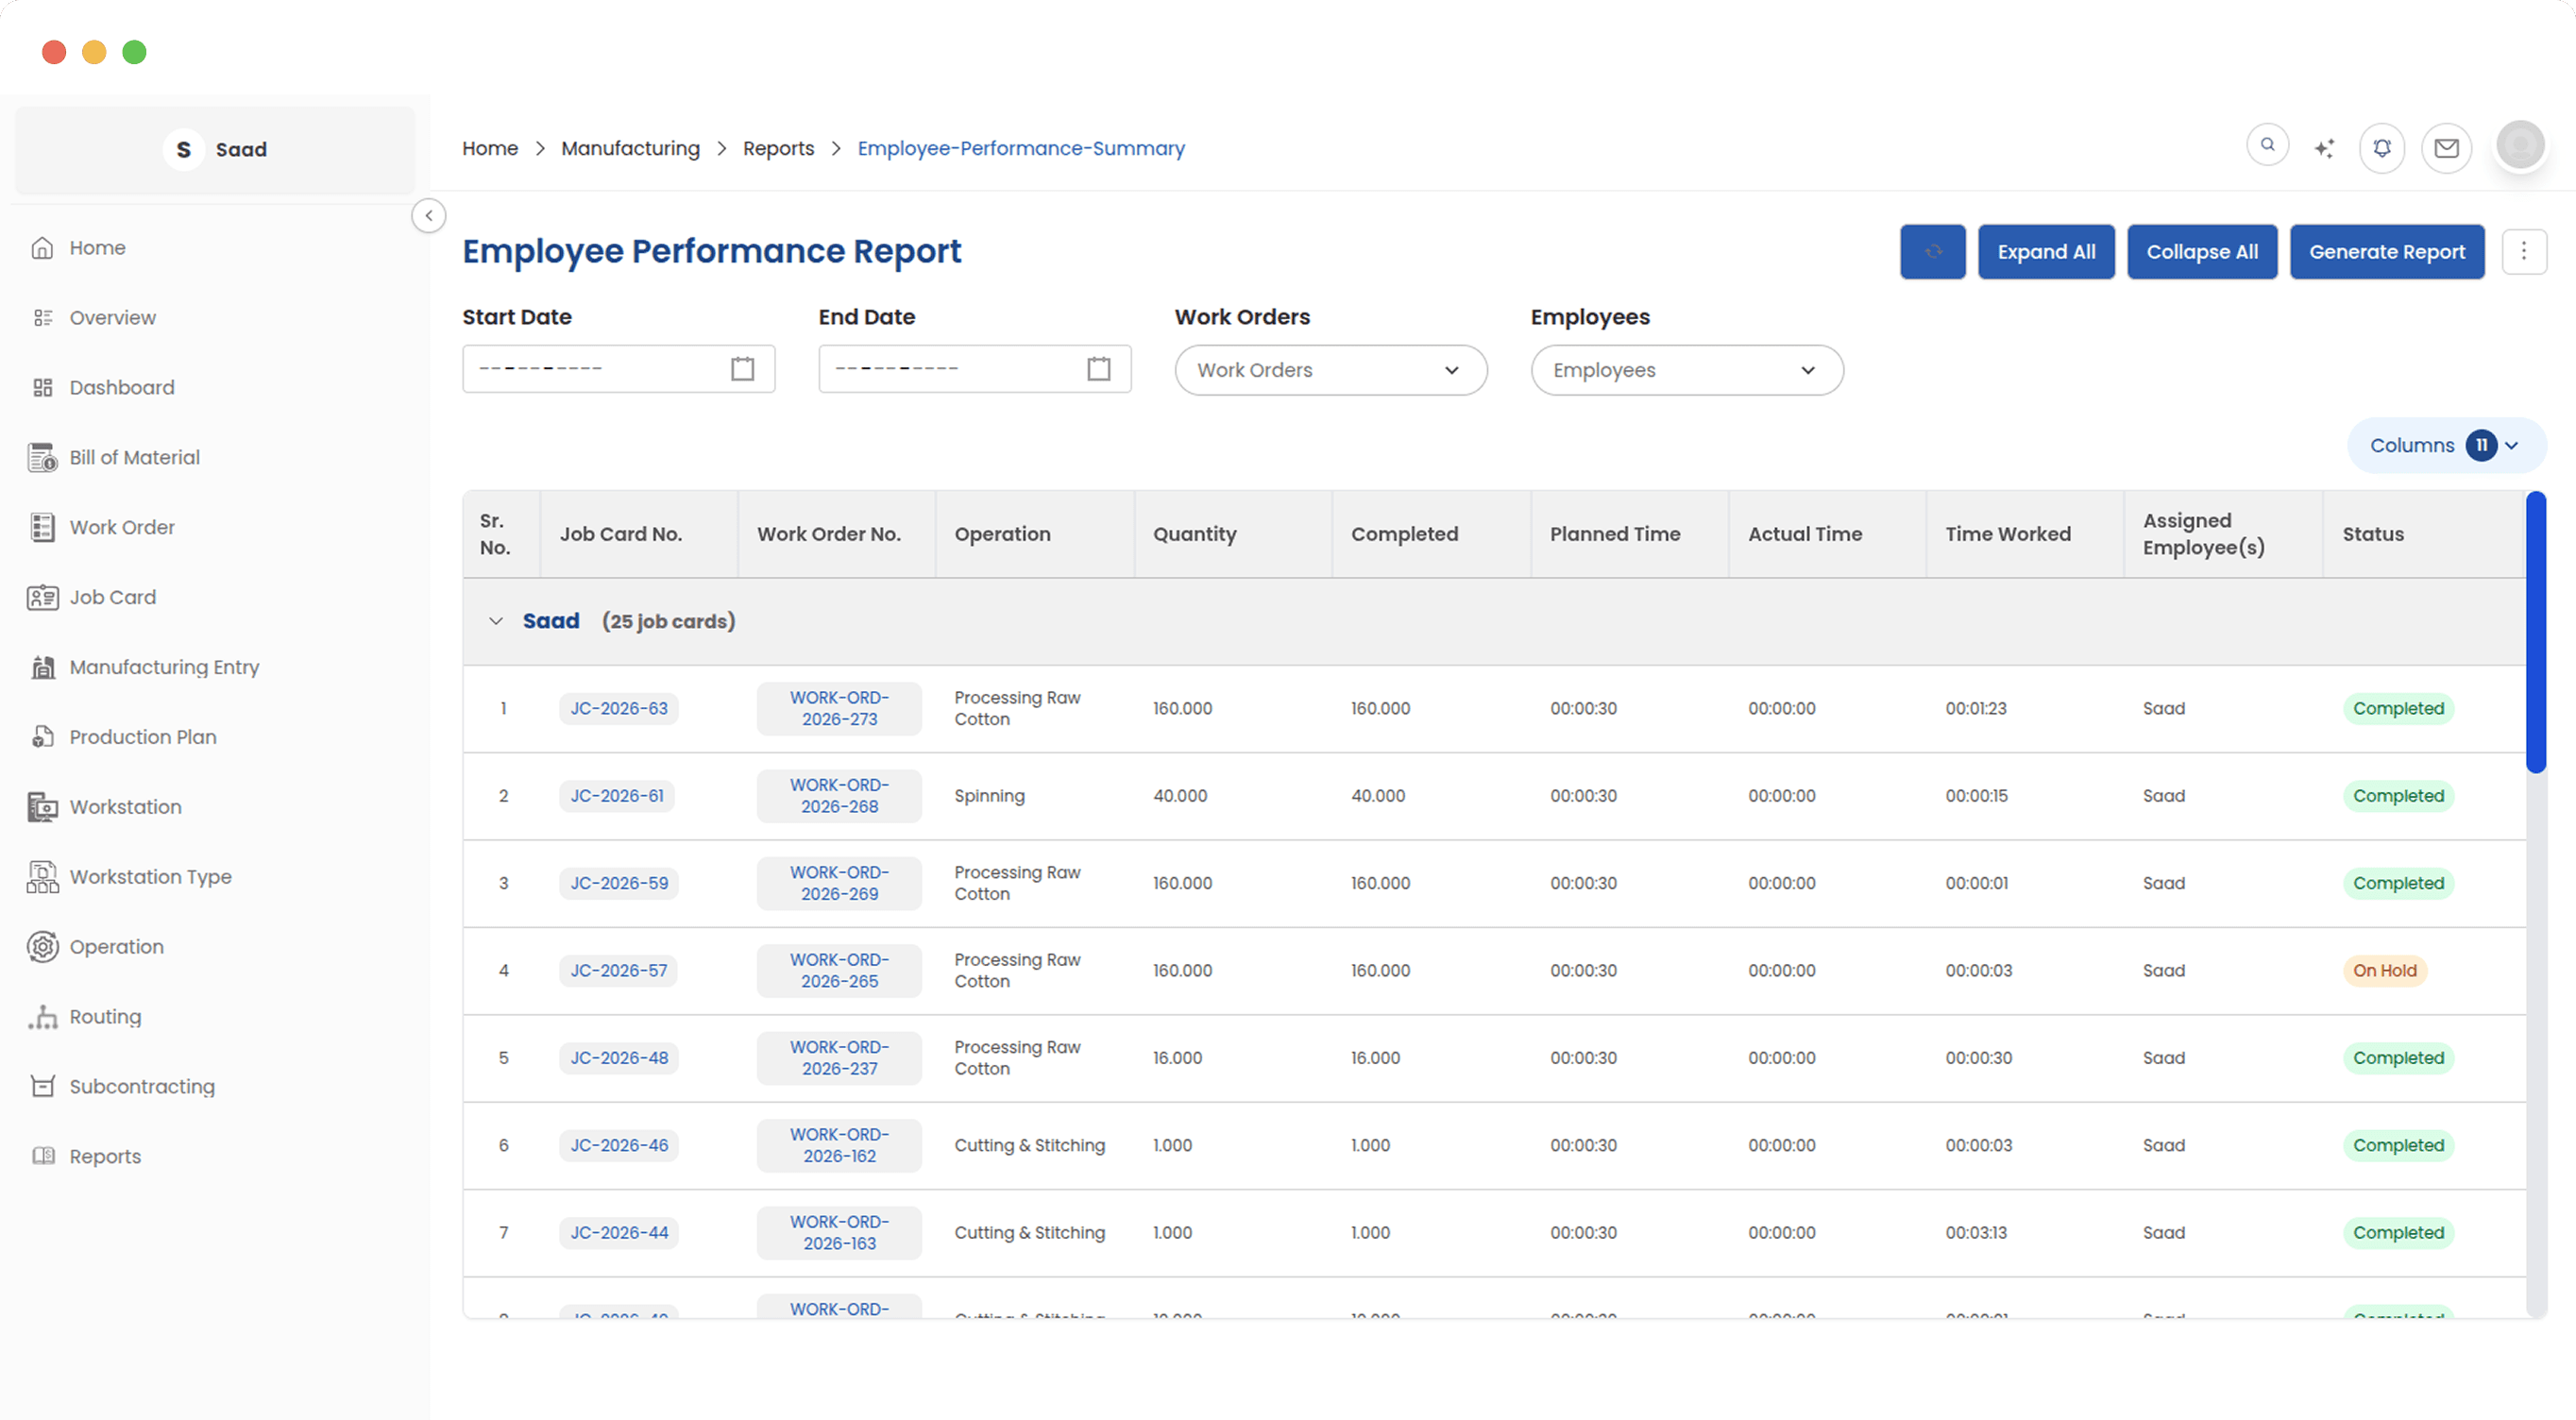
Measure what your team produces, not just how long they work
Completed job cards grouped by operator, with output, planned time, actual time and the minutes each person logged. It gives a review something to sit on other than an impression.
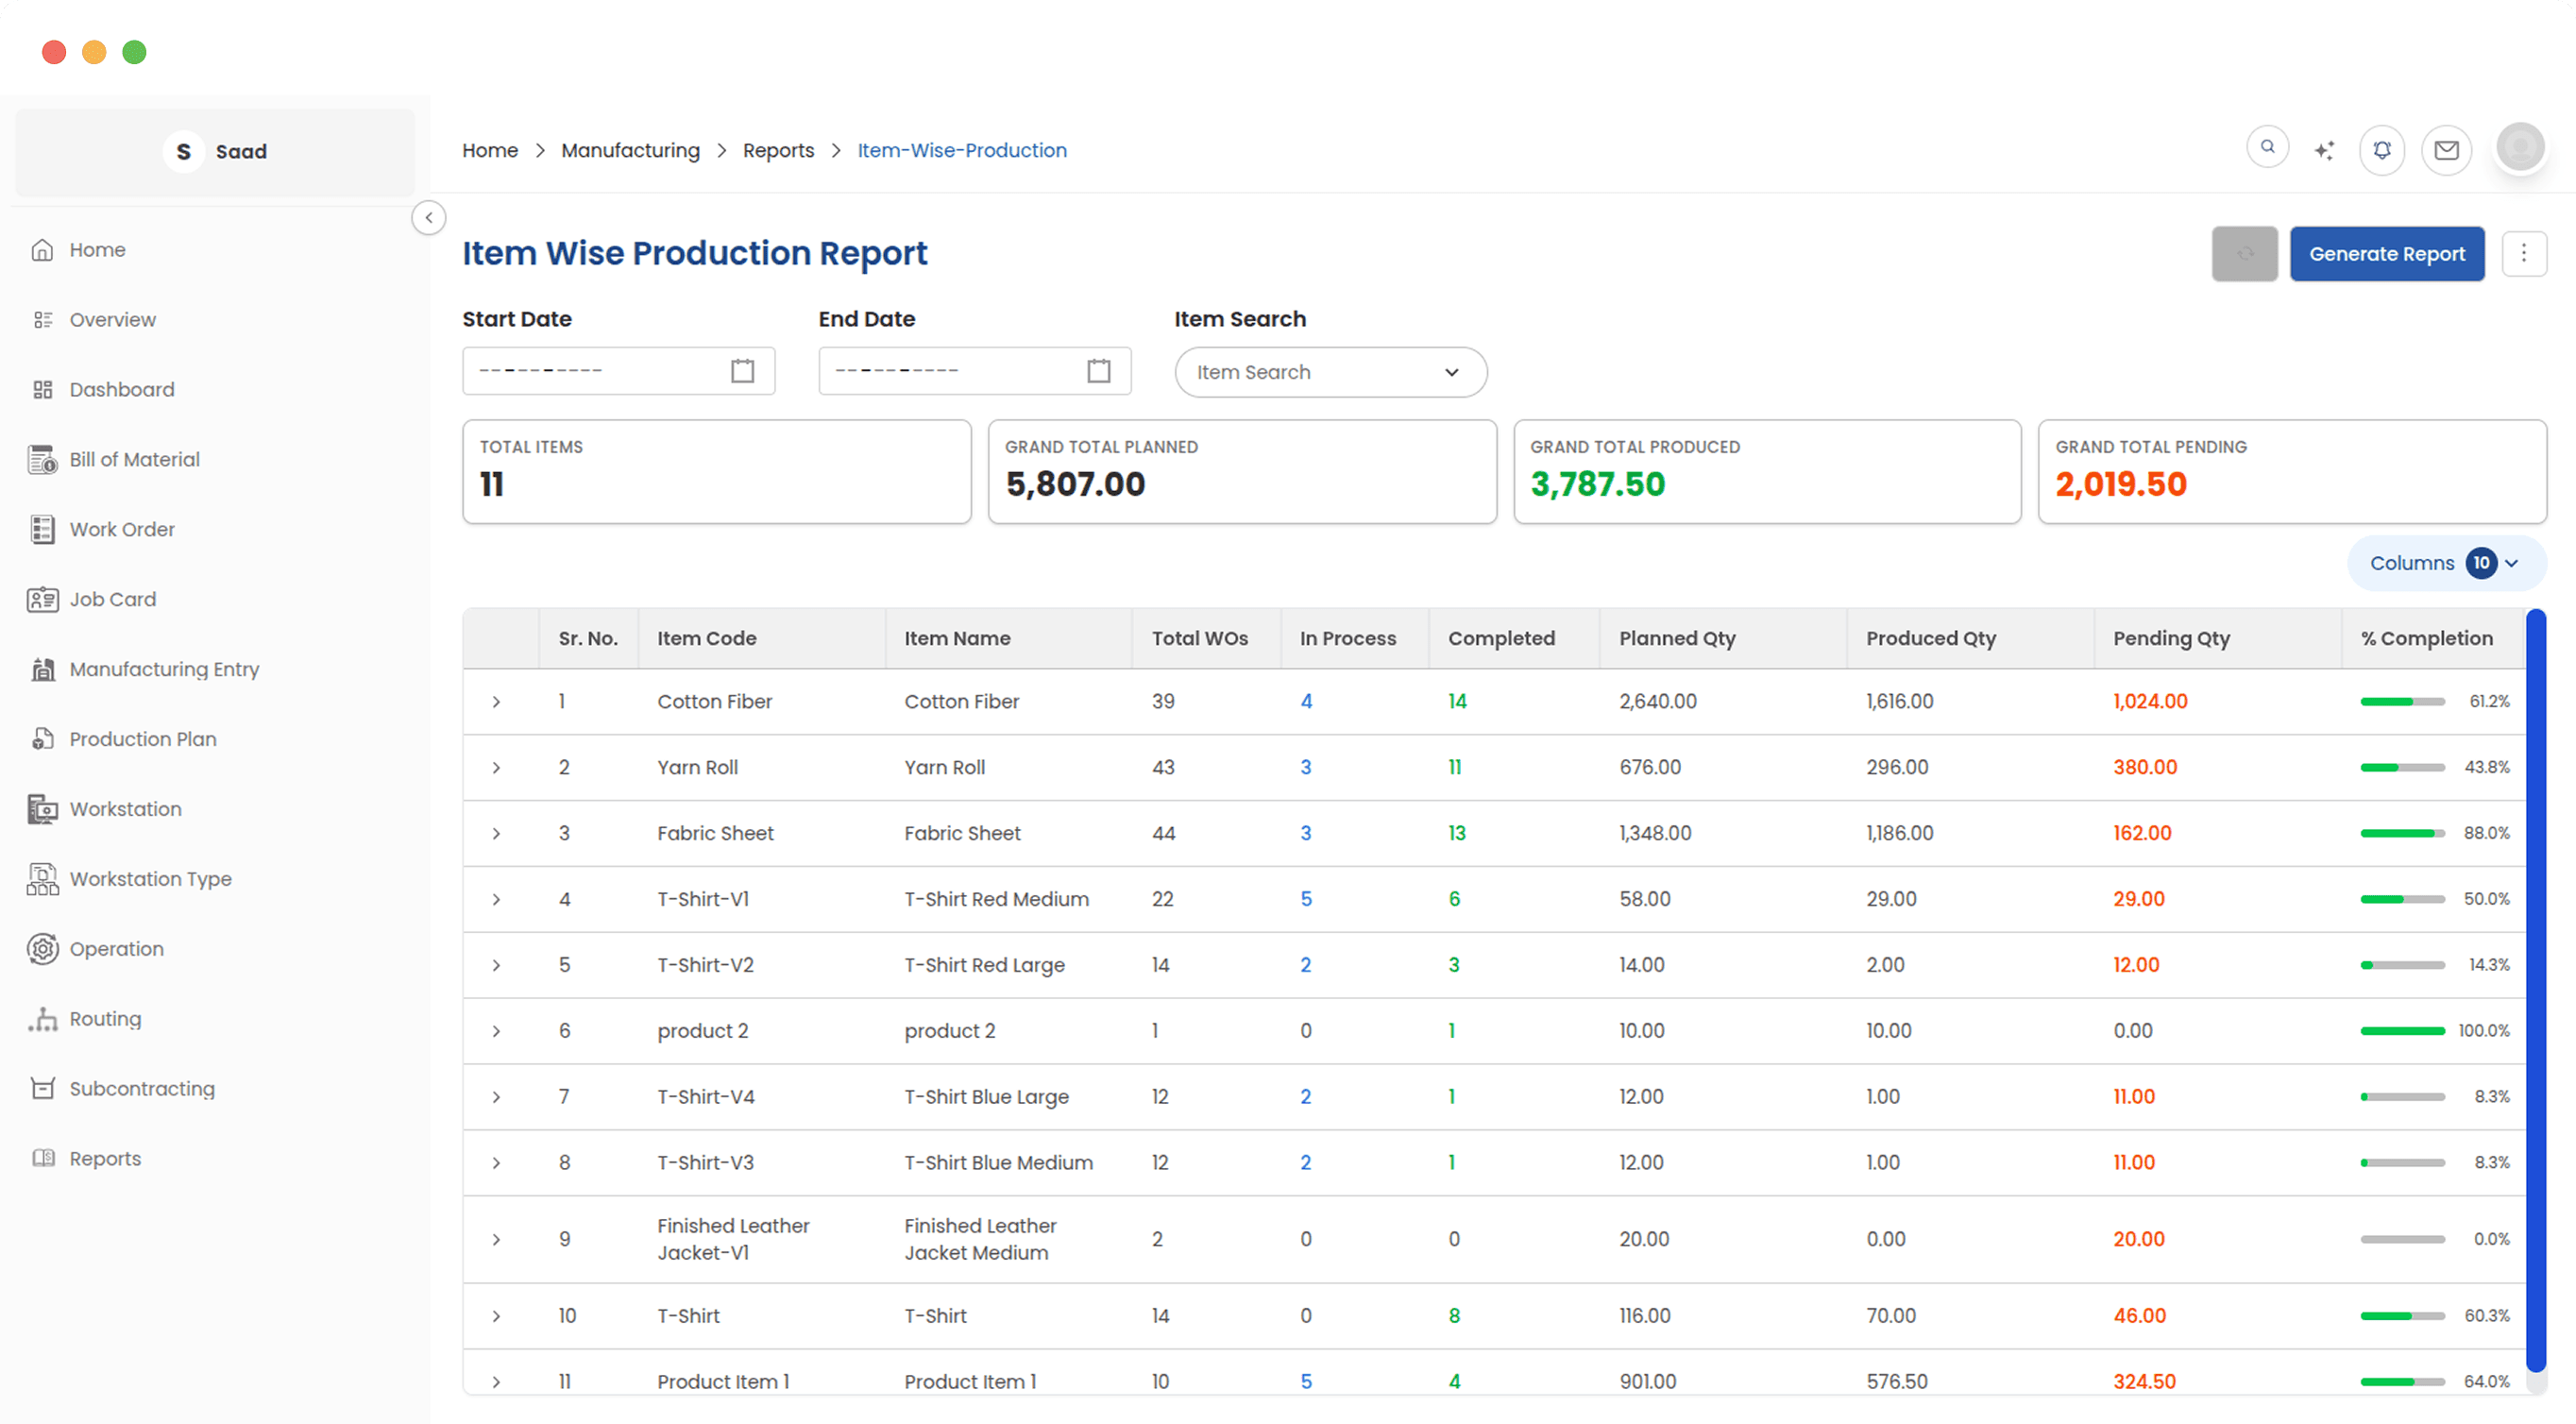
How much of each product you made
Quantities added up across every work order and grouped by the item produced. It is the input for next quarter targets, and for noticing that a product you thought was steady has halved.
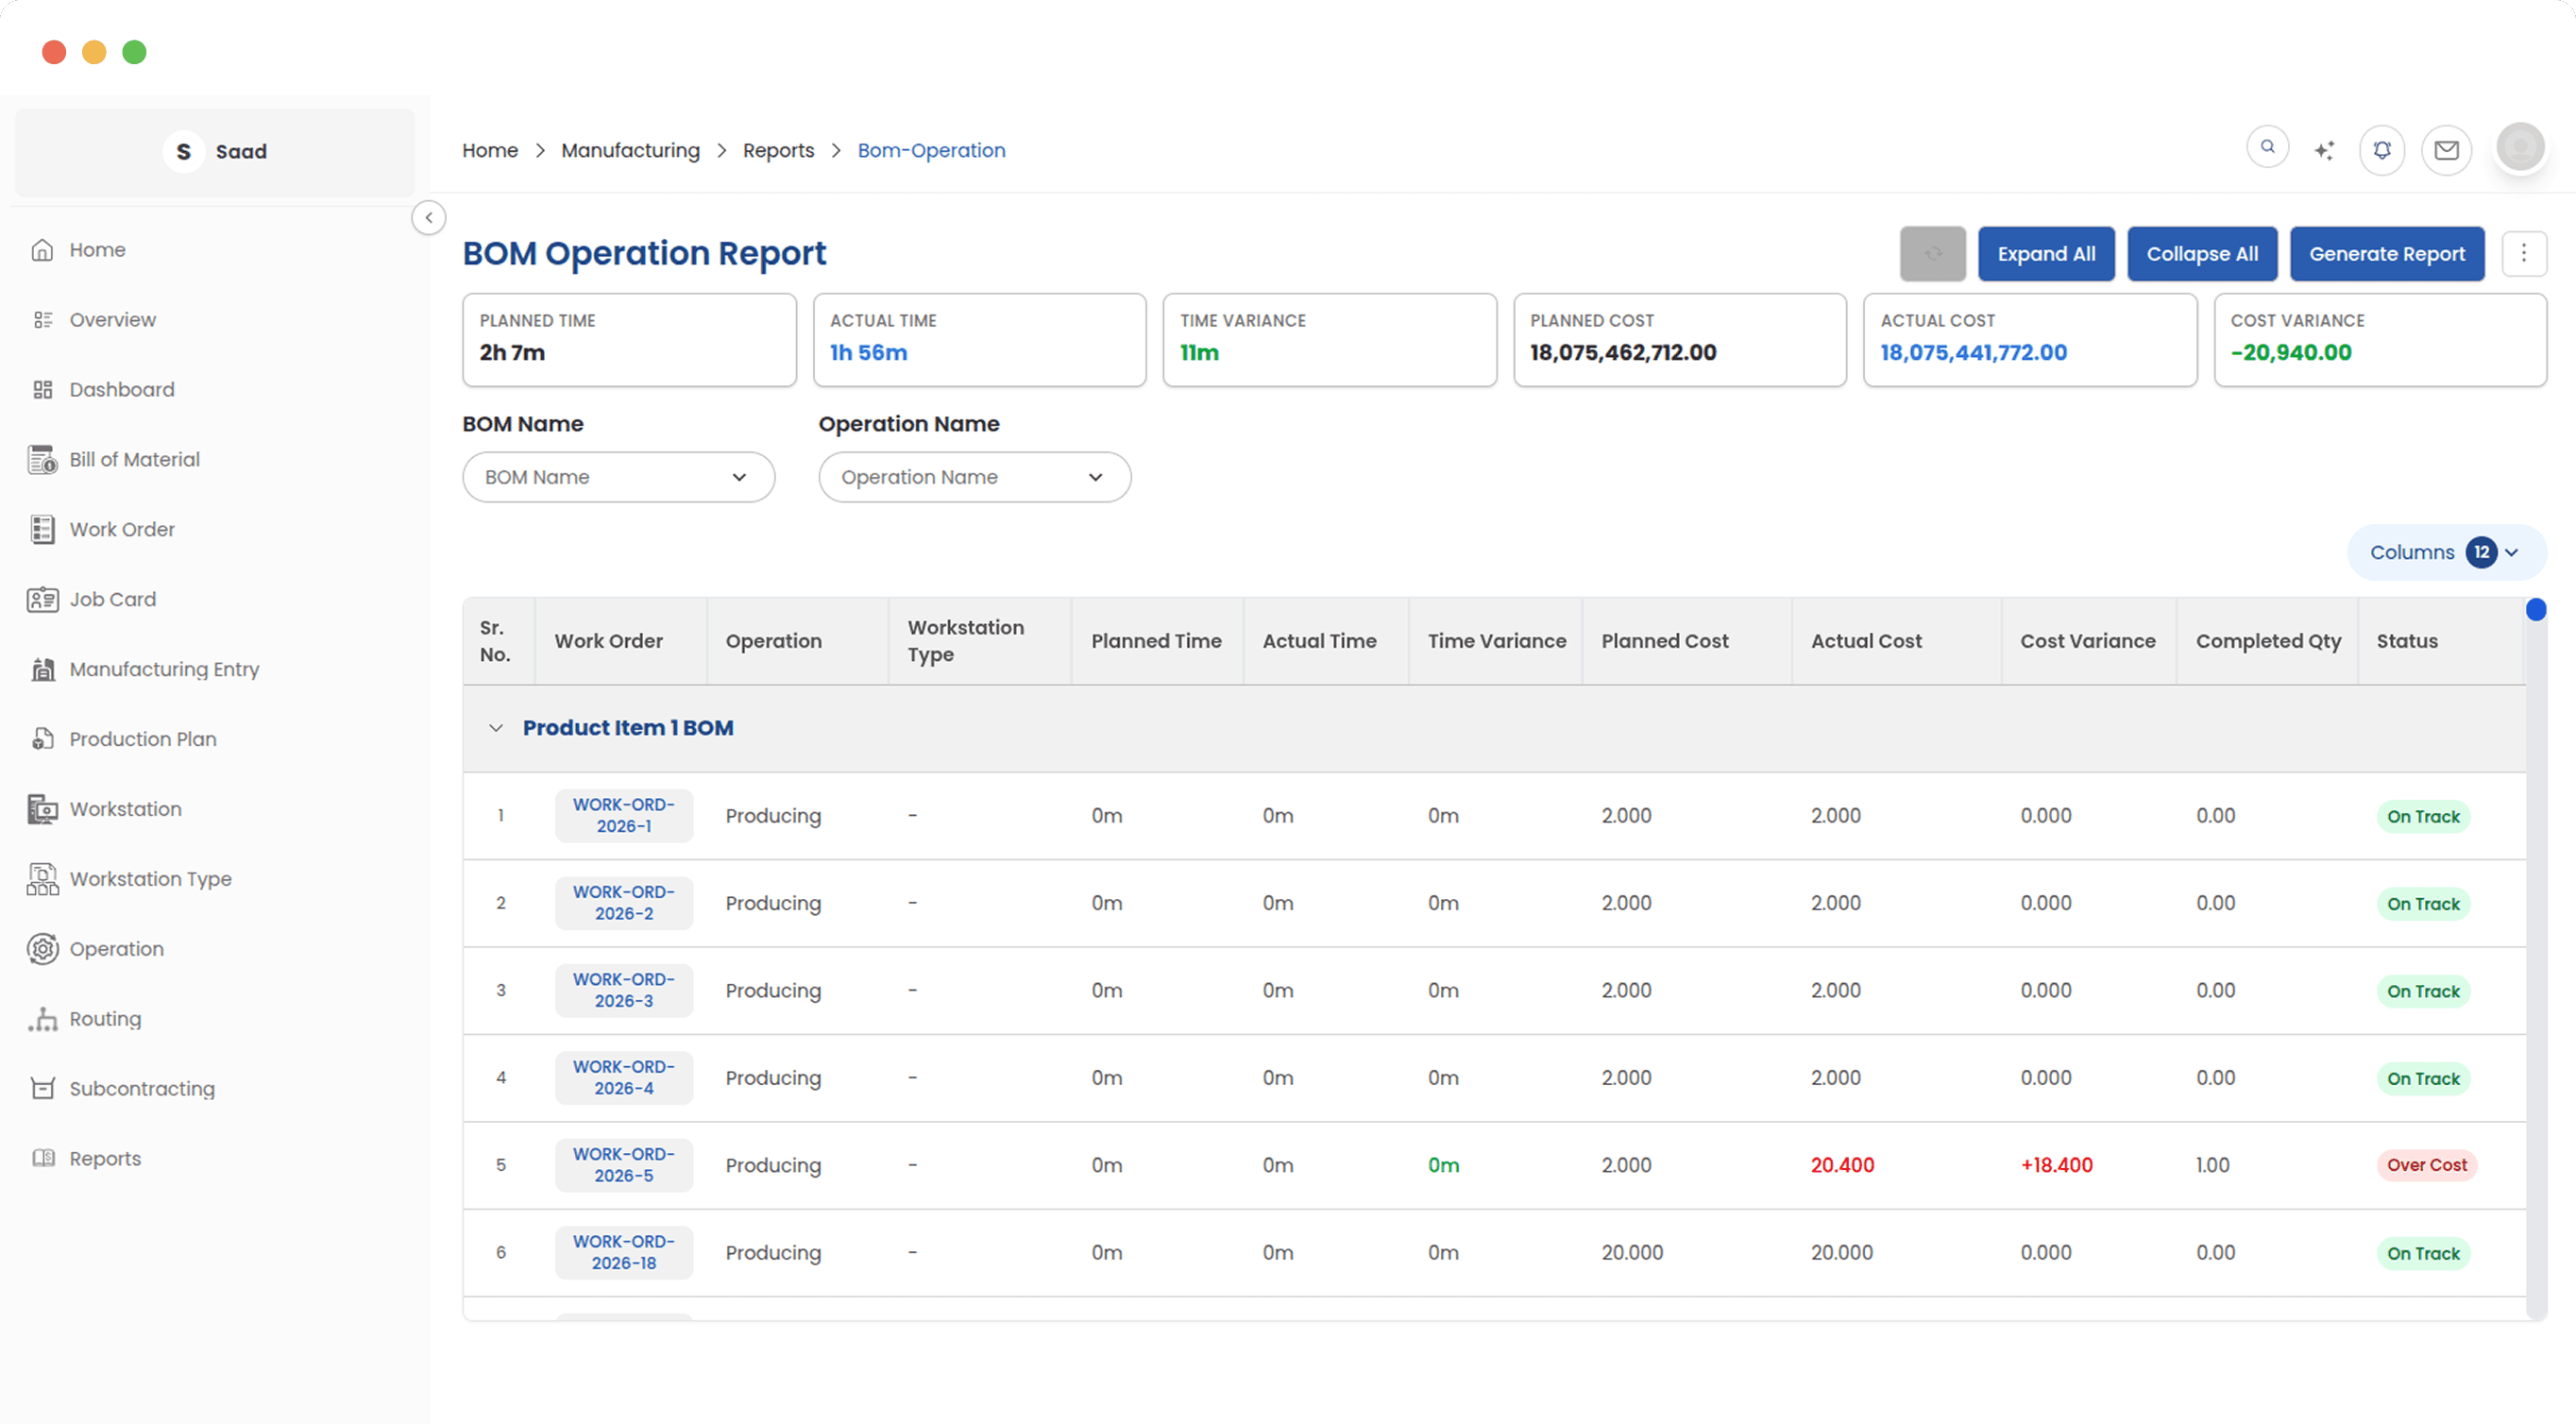
Find the operations that are holding production back
Planned operation durations against the times job cards actually recorded, across every BOM and work order. The operations that consistently run long are ranked, so improvement work starts with the one that costs most.
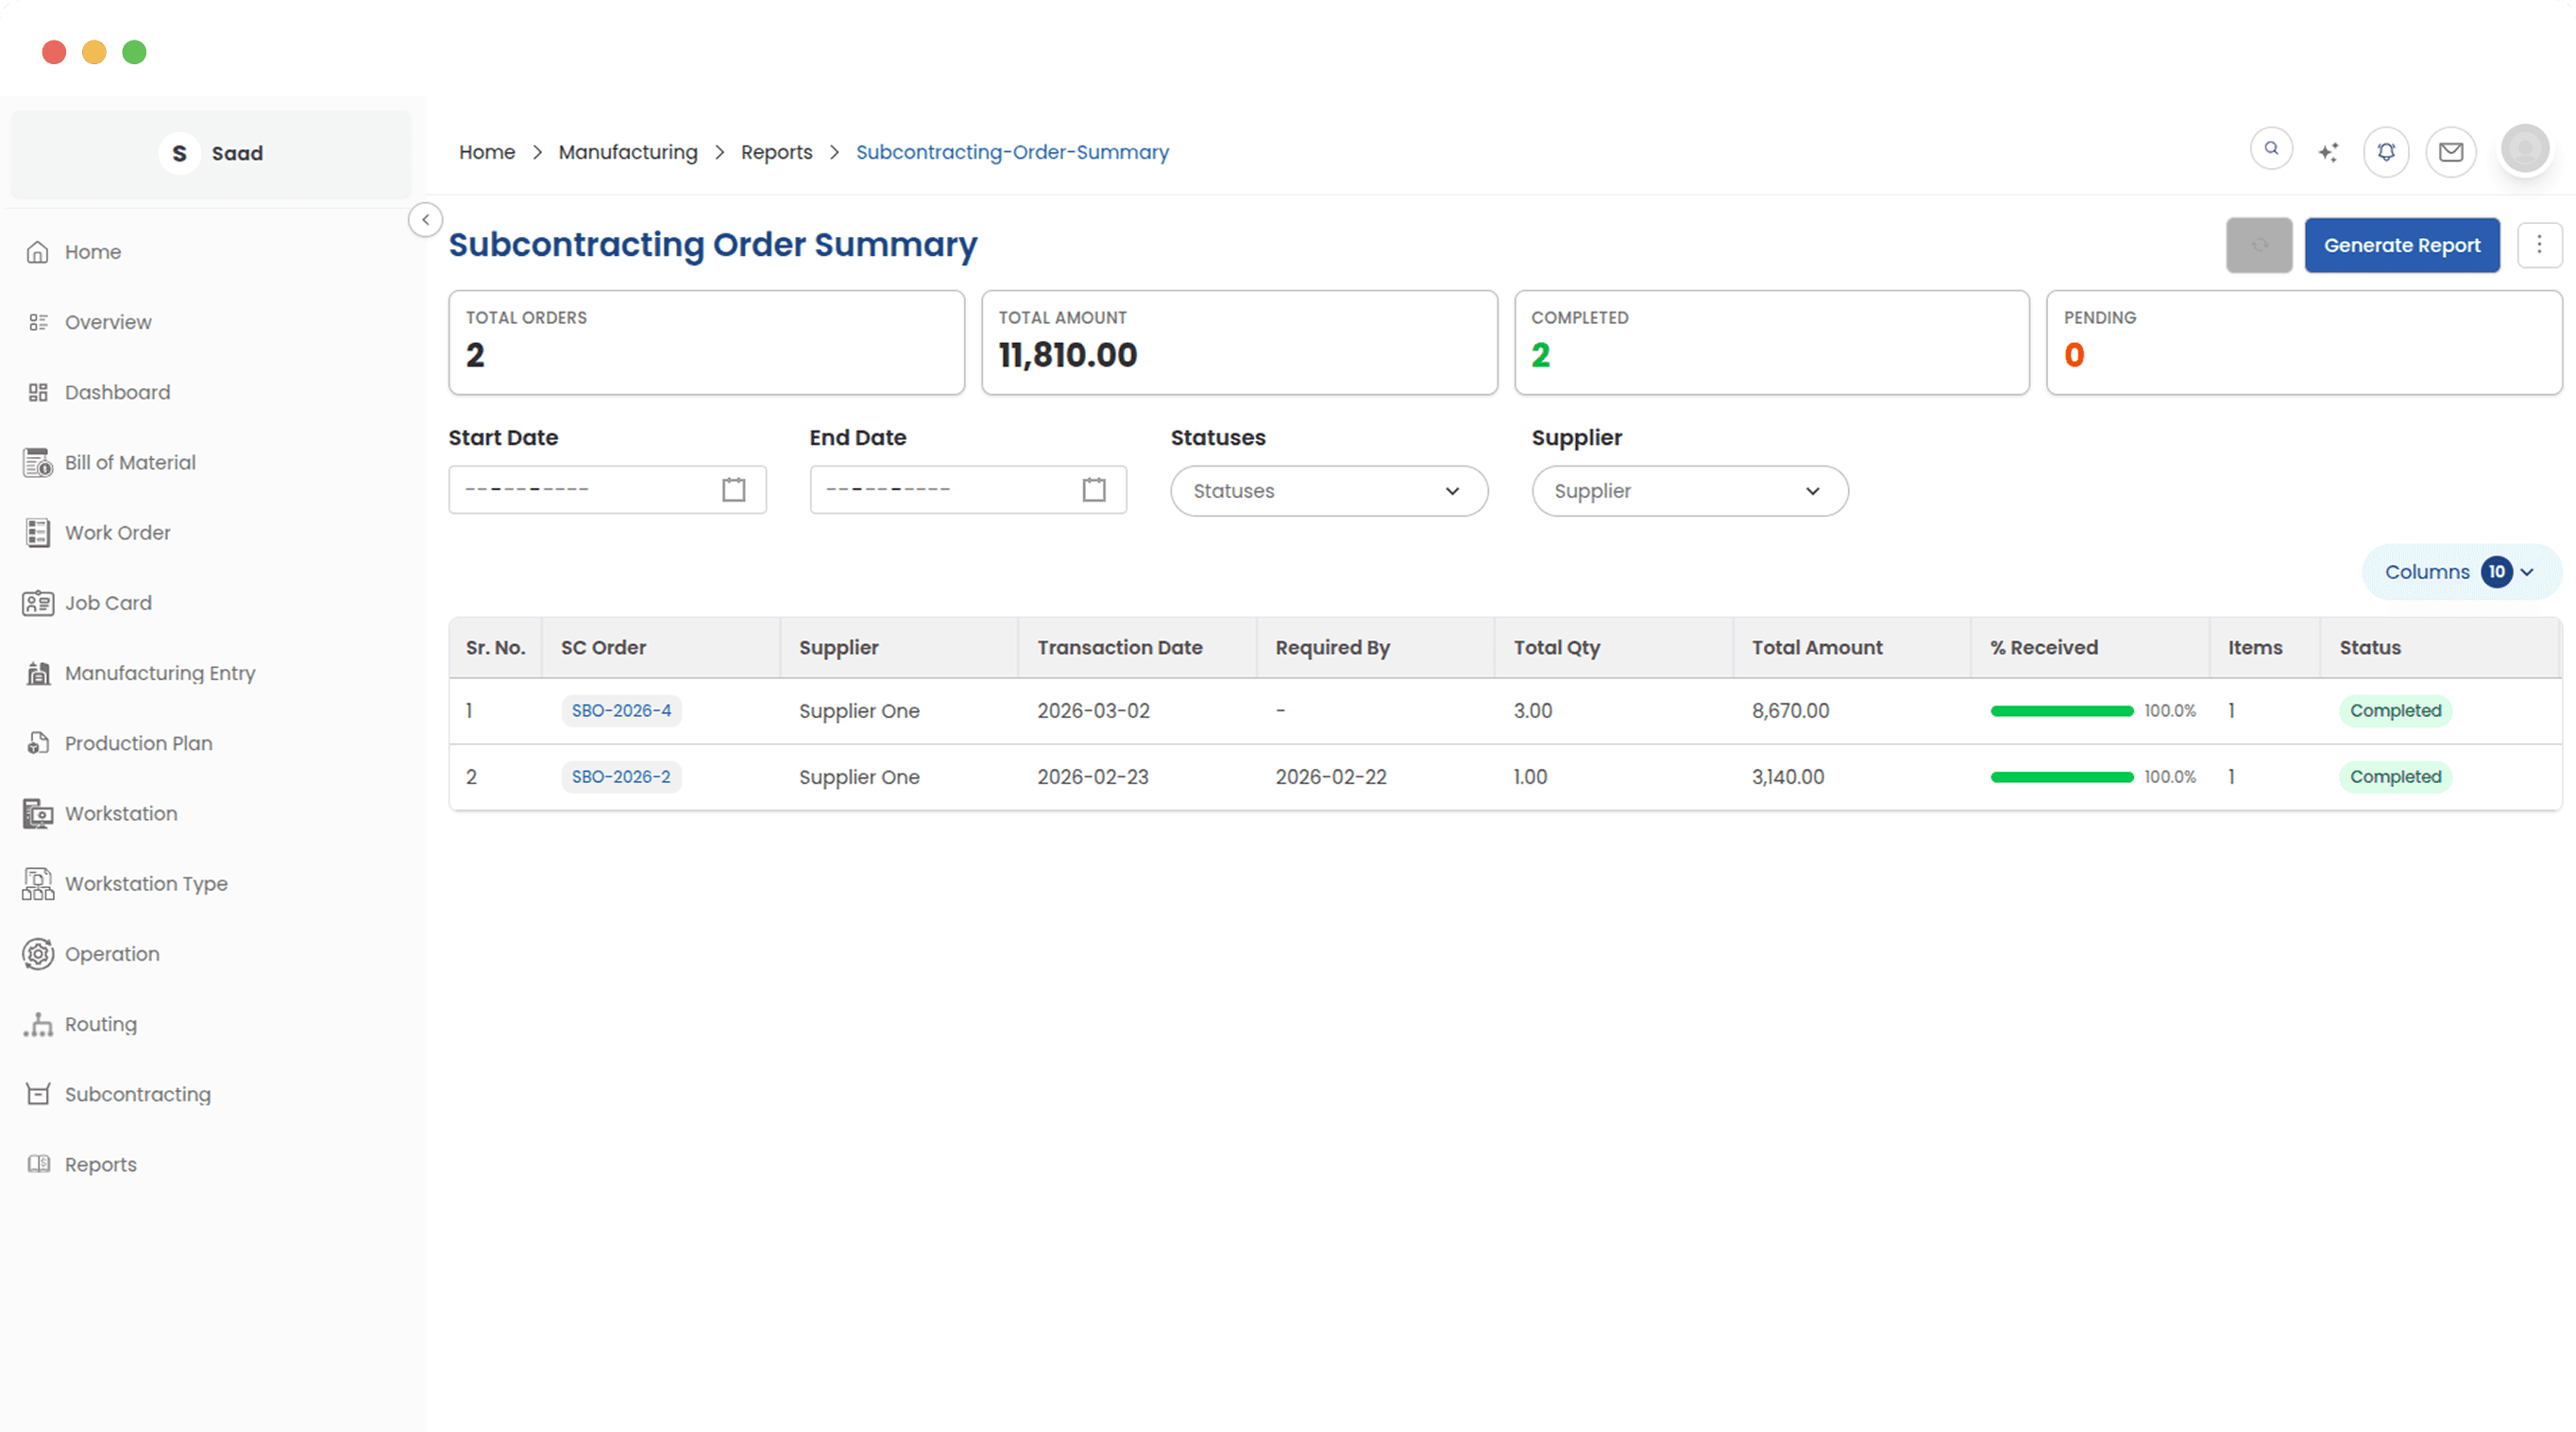
Every subcontracting order in one row each
What was ordered, how much material went out, and what has come back, for every subcontracting order. Procurement can read the whole outsourced picture without opening a record per supplier.
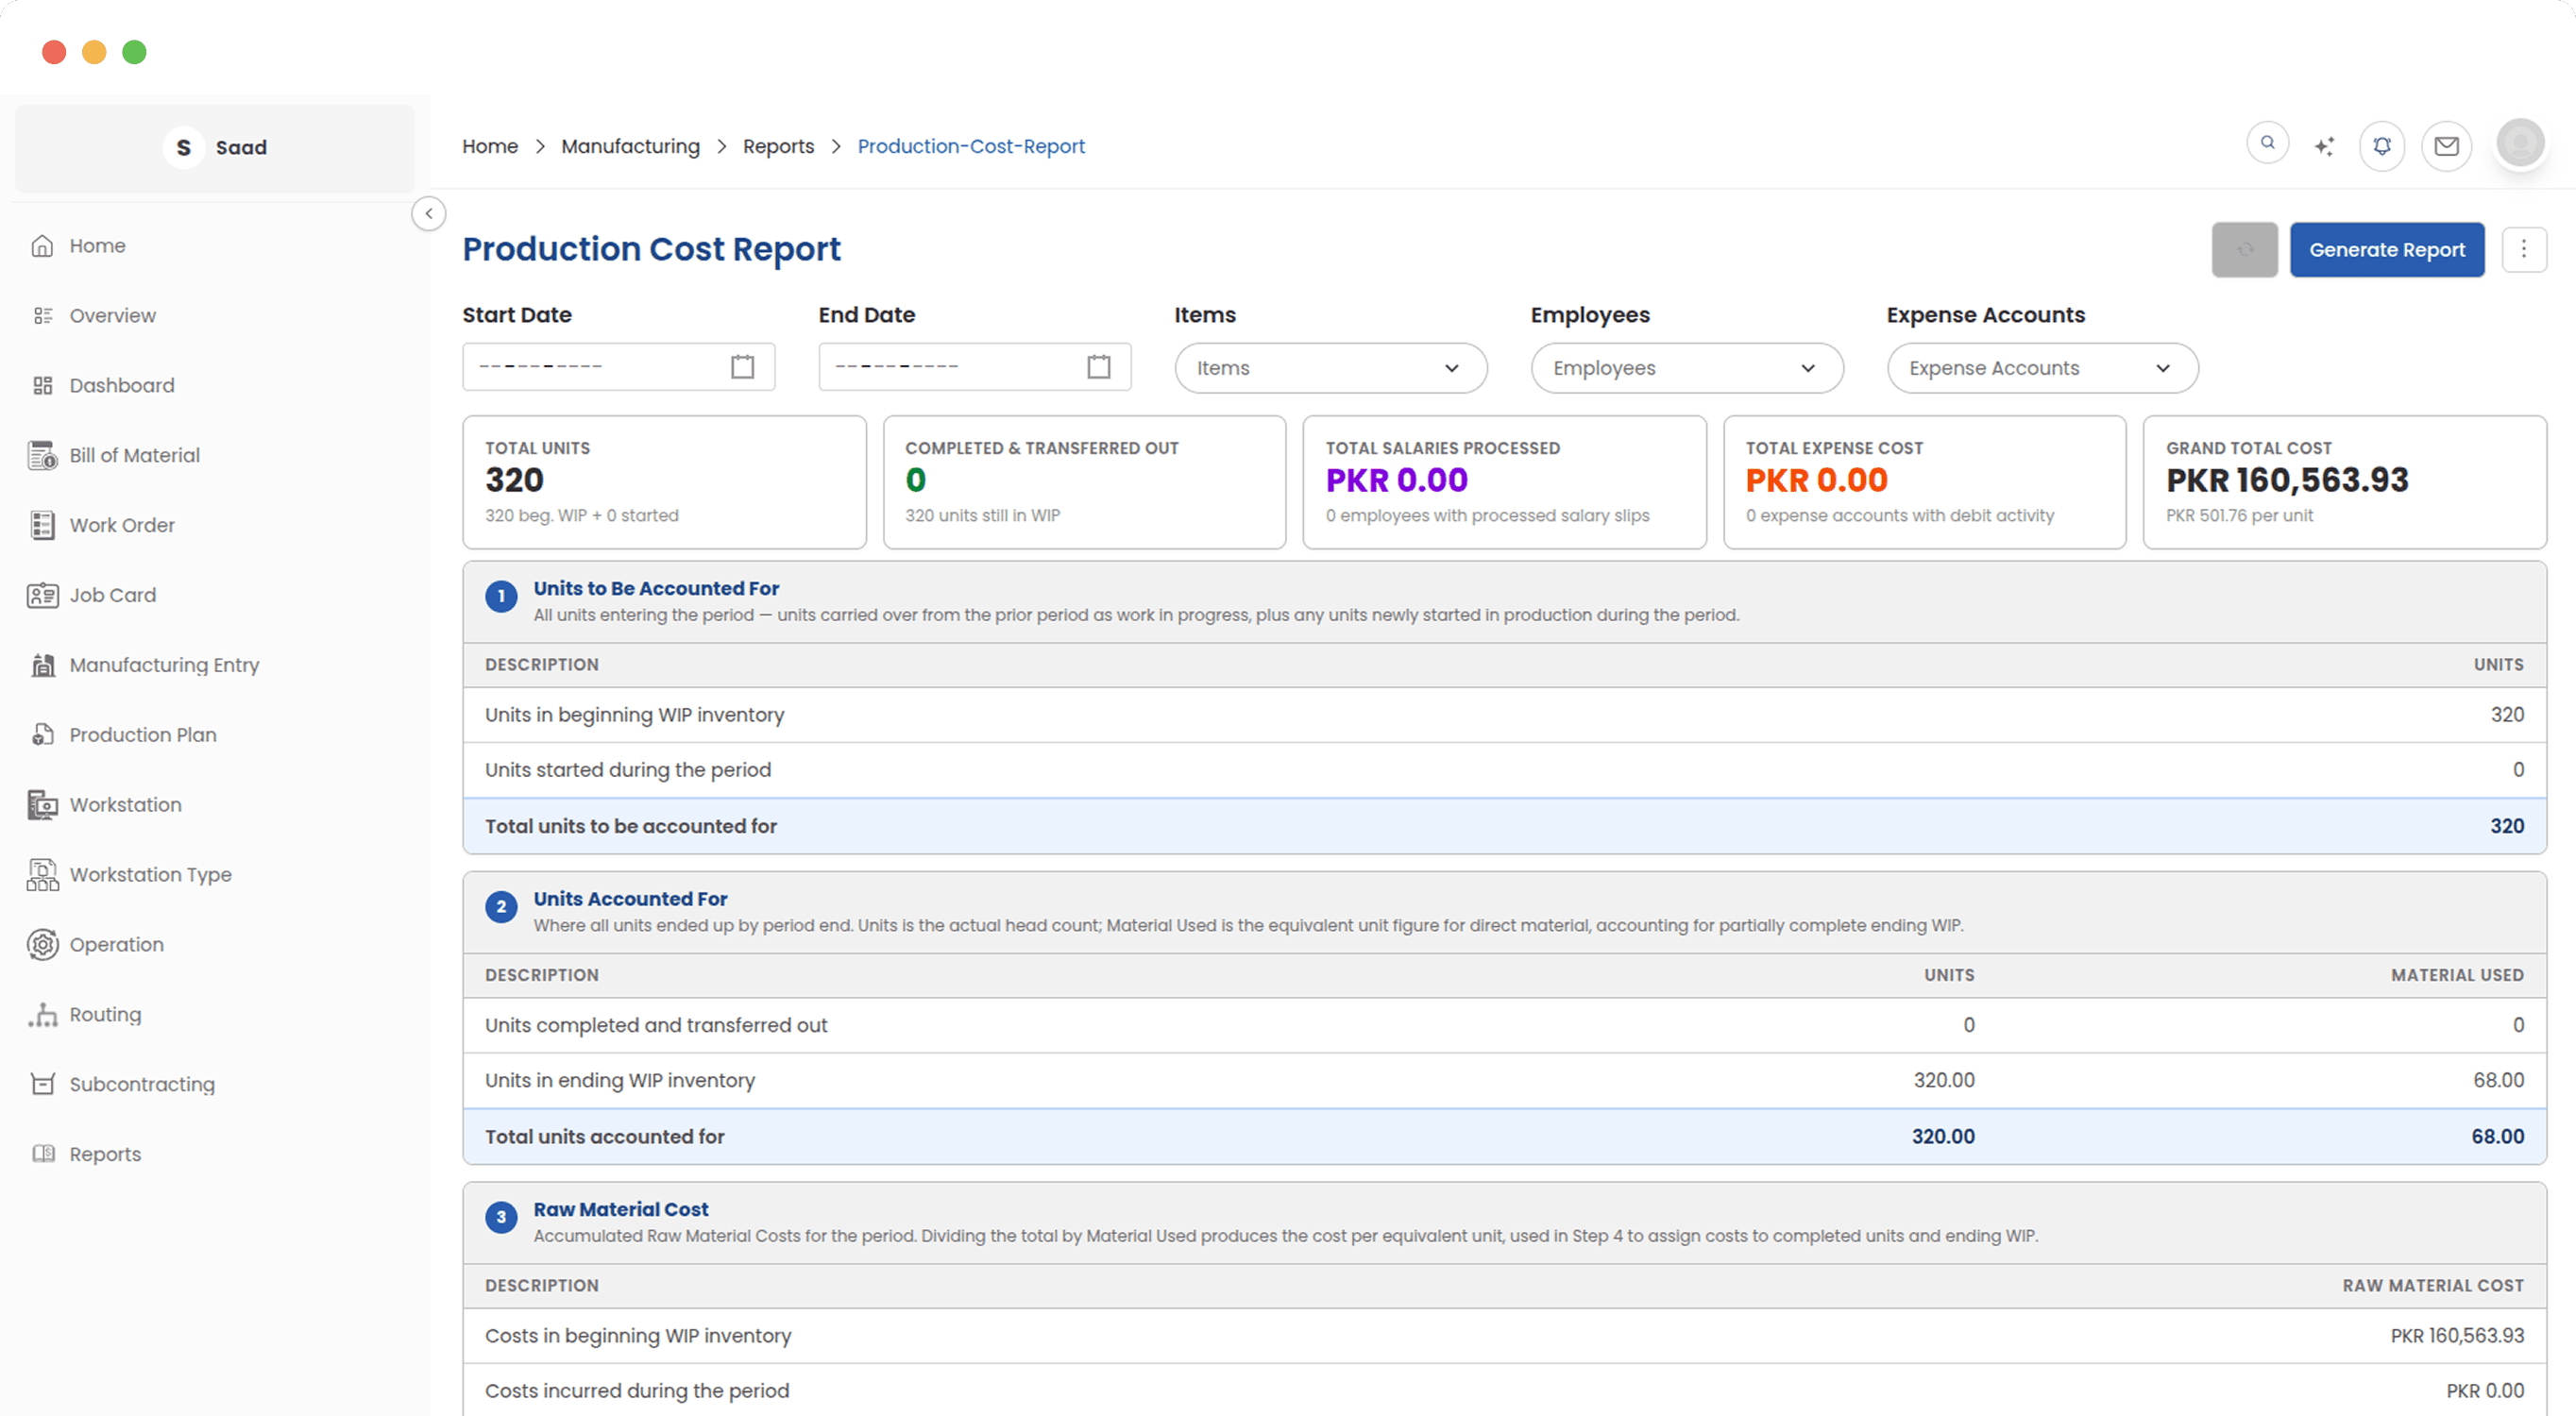
What a unit actually costs to make
A period cost breakdown using weighted average process costing. Direct material, direct labour, workstation overhead, salaries and allocated expenses come together into one cost per unit that finance and operations can both work from.
Nothing here needs exporting first
The reports are built on the same records the floor creates, so there is no reconciliation step and no lag between something happening and management being able to act on it.